Try out a new Lighthouse API to measure performance and best practices throughout a user flow.
Lighthouse is a fantastic tool for testing performance and best practices during initial page load. However, it's traditionally been difficult to use Lighthouse to analyze other aspects of the life of a page, such as:
- Page loads with a warm cache
- Pages with an activated Service Worker
- Accounting for potential user interactions
This means that Lighthouse can miss vital information. The Core Web Vitals are based on all page loads, not just those with an empty cache. Additionally, metrics like Cumulative Layout Shift (CLS) are measurable for the entire time a page is open.
Lighthouse has a new user flow API that allows lab testing at any point within a page's lifespan. Puppeteer is used to script page loads and trigger synthetic user interactions, and Lighthouse can be invoked in multiple ways to capture key insights during those interactions. This means that performance can be measured during page load and during interactions with the page. Accessibility checks can be run in CI, not just on the initial view but deep within your checkout flow to make sure nothing regresses.
Almost any Puppeteer script written to ensure a working user flow can now have Lighthouse inserted at any point to measure performance and best practices throughout. This tutorial will walk through the new Lighthouse modes that can measure different parts of user flows: navigations, snapshots, and timespans.
Setup
The user flow APIs are still in preview, but they are available in Lighthouse today. To try out the demos below, you'll need Node version 14 or later. Create an empty directory and in it run:
# Default to ES modules.
echo '{"type": "module"}' > package.json

# Init npm project without the wizard.
npm init -y

# Dependencies for these examples.
npm install lighthouse puppeteer open
Navigations
The new Lighthouse "navigation" mode is actually giving a name to the (up until now) standard Lighthouse behavior: analyze the cold load of a page. This is the mode to use to monitor page load performance, but user flows also open up the possibility of new insights.
To script Lighthouse capturing a page load:
- Use puppeteer to open the browser.
- Start a Lighthouse user flow.
- Navigate to the target URL.
import fs from 'fs';
import open from 'open';
import puppeteer from 'puppeteer';
import {startFlow} from 'lighthouse/lighthouse-core/fraggle-rock/api.js';

async function captureReport() {
  const browser = await puppeteer.launch({headless: false});
  const page = await browser.newPage();

  const flow = await startFlow(page, {name: 'Single Navigation'});
  await flow.navigate('https://web.dev/performance-scoring/');

  await browser.close();

  const report = await flow.generateReport();
  fs.writeFileSync('flow.report.html', report);
  open('flow.report.html', {wait: false});
}

captureReport();
This is the simplest flow. When opened, the report shows a summary view with only the single step. Clicking on that step will reveal a traditional Lighthouse report for that navigation.
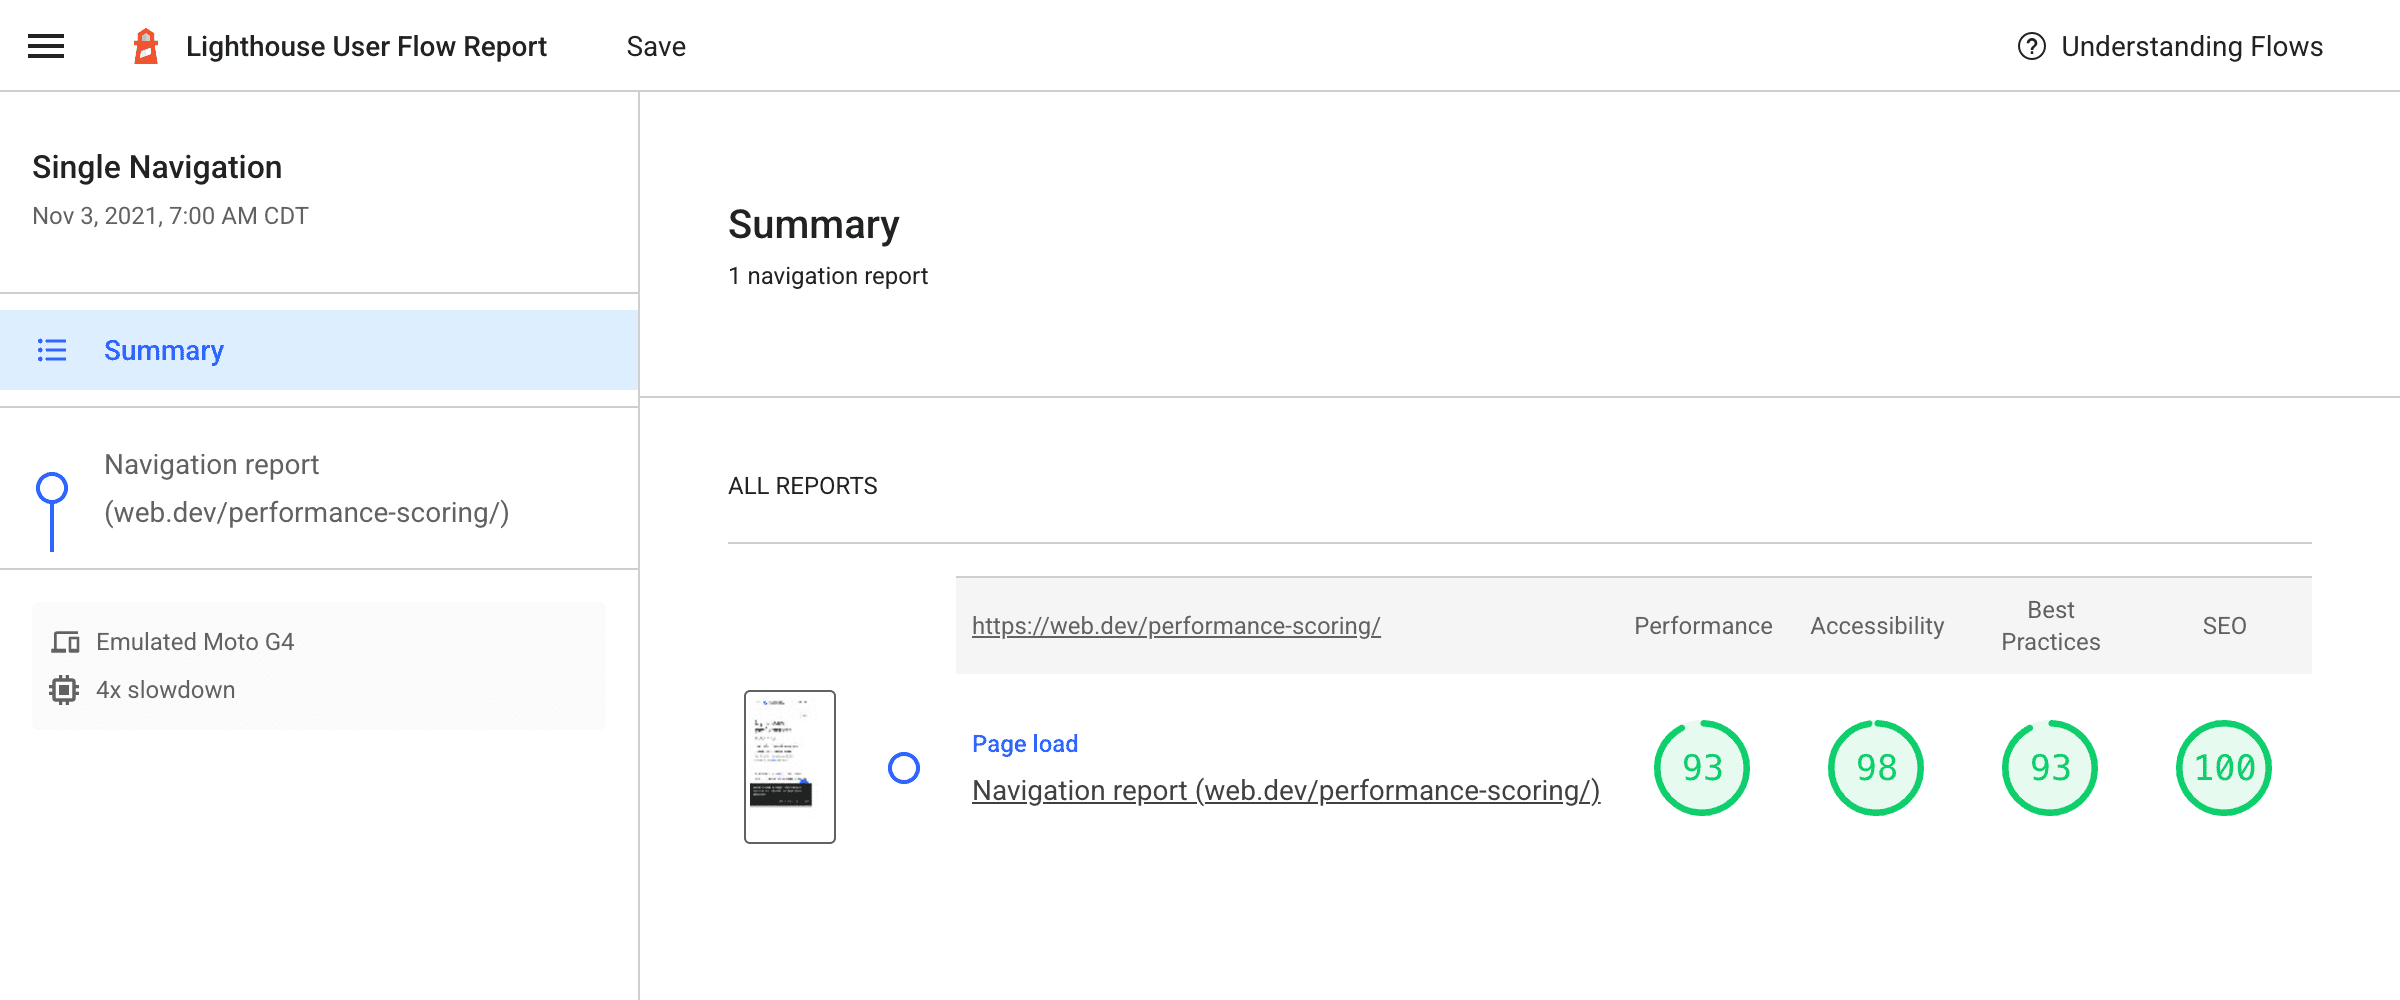
As is typical with Lighthouse, this page is loaded with any cache or local storage cleared first, but real users visiting a site will have a mixture of visits with cold and warm caches, and there can be a large performance difference between a cold load like this and a user returning to the page with a still-warm cache.
Capturing a warm load
You can also add a second navigation to this script, this time disabling the clearing of cache and storage that Lighthouse does by default in navigations. This next example loads an article on web.dev itself to see how much it benefits from caching:
async function captureReport() {
  const browser = await puppeteer.launch({headless: false});
  const page = await browser.newPage();

  const testUrl = 'https://web.dev/performance-scoring/';
  const flow = await startFlow(page, {name: 'Cold and warm navigations'});
  await flow.navigate(testUrl, {
    stepName: 'Cold navigation'
  });
  await flow.navigate(testUrl, {
    stepName: 'Warm navigation',
    configContext: {
      settingsOverrides: {disableStorageReset: true},
    },
  });

  await browser.close();

  const report = await flow.generateReport();
  fs.writeFileSync('flow.report.html', report);
  open('flow.report.html', {wait: false});
}

captureReport();
The resulting flow report looks something like this:
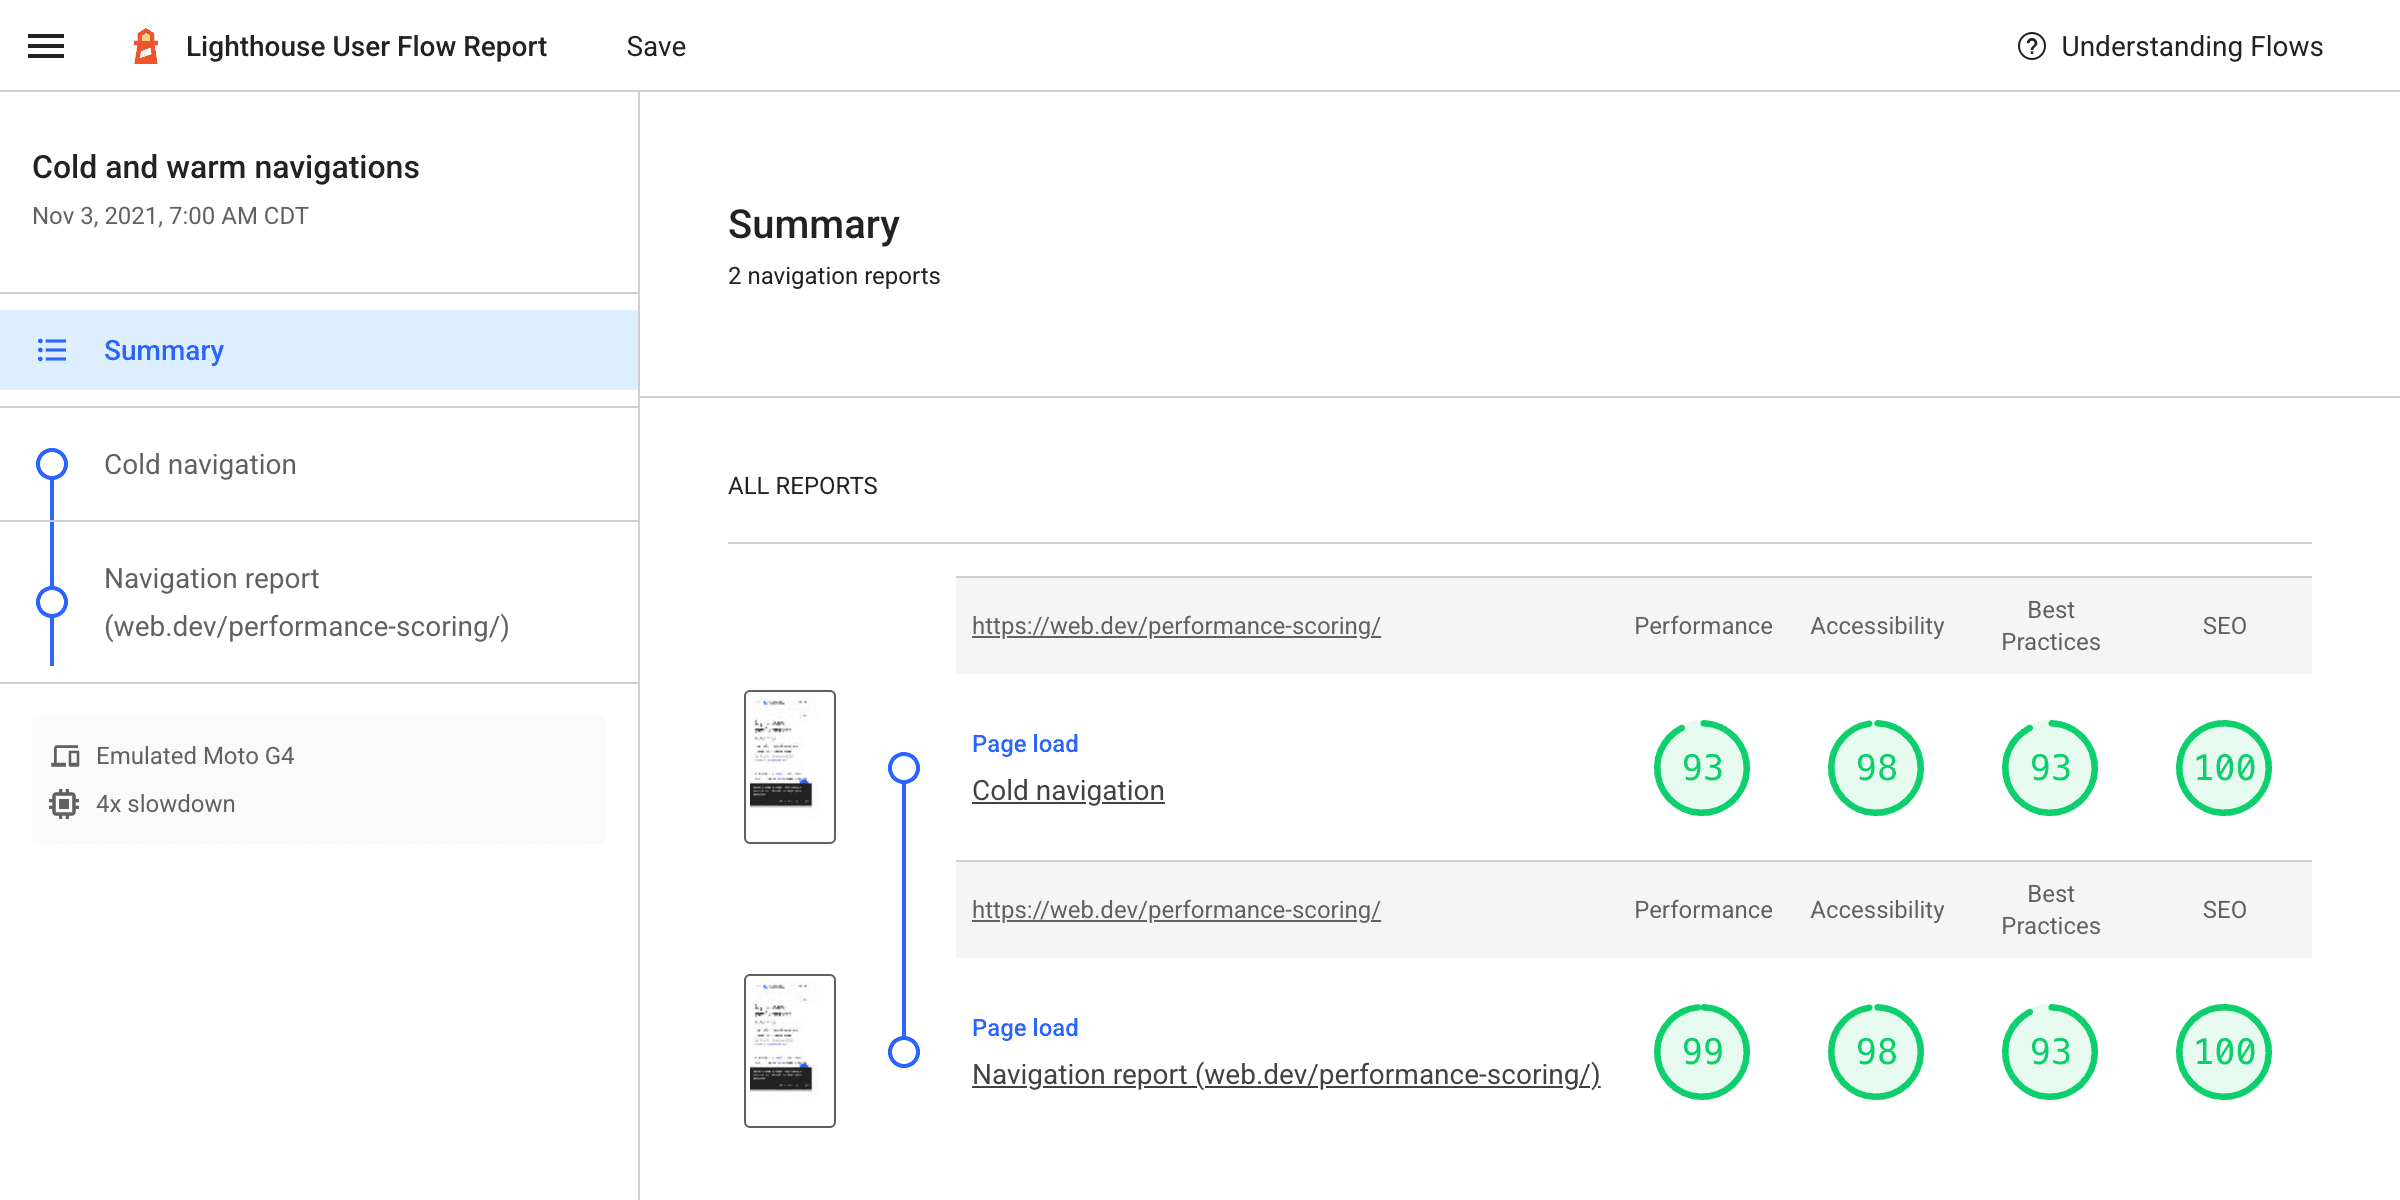
The combination of cold and warm loads offers a fuller picture of what real users are experiencing. If you have a site where users load many pages in the same visit, this may be able to give you a more realistic look at what they're experiencing in the field.
Snapshots
Snapshots are a new mode that runs Lighthouse audits at a single point in time. Unlike a normal Lighthouse run, the page is not reloaded. This unlocks the ability to set up a page and test it in its exact state: with a drop-down open or a form partially filled in, for example.
For this example, suppose you want to check that some new UI for Advanced Settings within Squoosh passes the automated Lighthouse checks. These settings are only visible if an image has been loaded and the options menu is expanded to show the advanced settings.
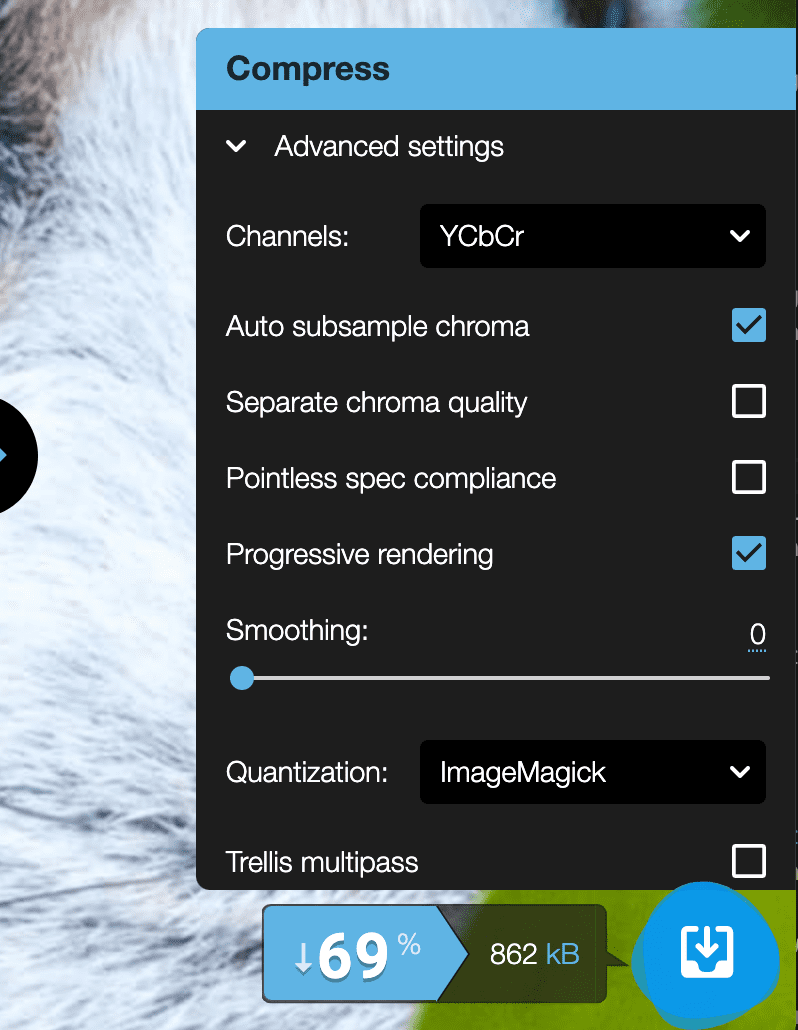
This process is scriptable with Puppeteer and you can actually take a Lighthouse snapshot at each step:
async function captureReport() {
  const browser = await puppeteer.launch({headless: false});
  const page = await browser.newPage();

  const flow = await startFlow(page, {name: 'Squoosh snapshots'});

  await page.goto('https://squoosh.app/', {waitUntil: 'networkidle0'});

  // Wait for first demo-image button, then open it.
  const demoImageSelector = 'ul[class*="demos"] button';
  await page.waitForSelector(demoImageSelector);
  await flow.snapshot({stepName: 'Page loaded'});
  await page.click(demoImageSelector);

  // Wait for advanced settings button in UI, then open them.
  const advancedSettingsSelector = 'form label[class*="option-reveal"]';
  await page.waitForSelector(advancedSettingsSelector);
  await flow.snapshot({stepName: 'Demo loaded'});
  await page.click(advancedSettingsSelector);

  await flow.snapshot({stepName: 'Advanced settings opened'});

  browser.close();

  const report = await flow.generateReport();
  fs.writeFileSync('flow.report.html', report);
  open('flow.report.html', {wait: false});
}

captureReport();
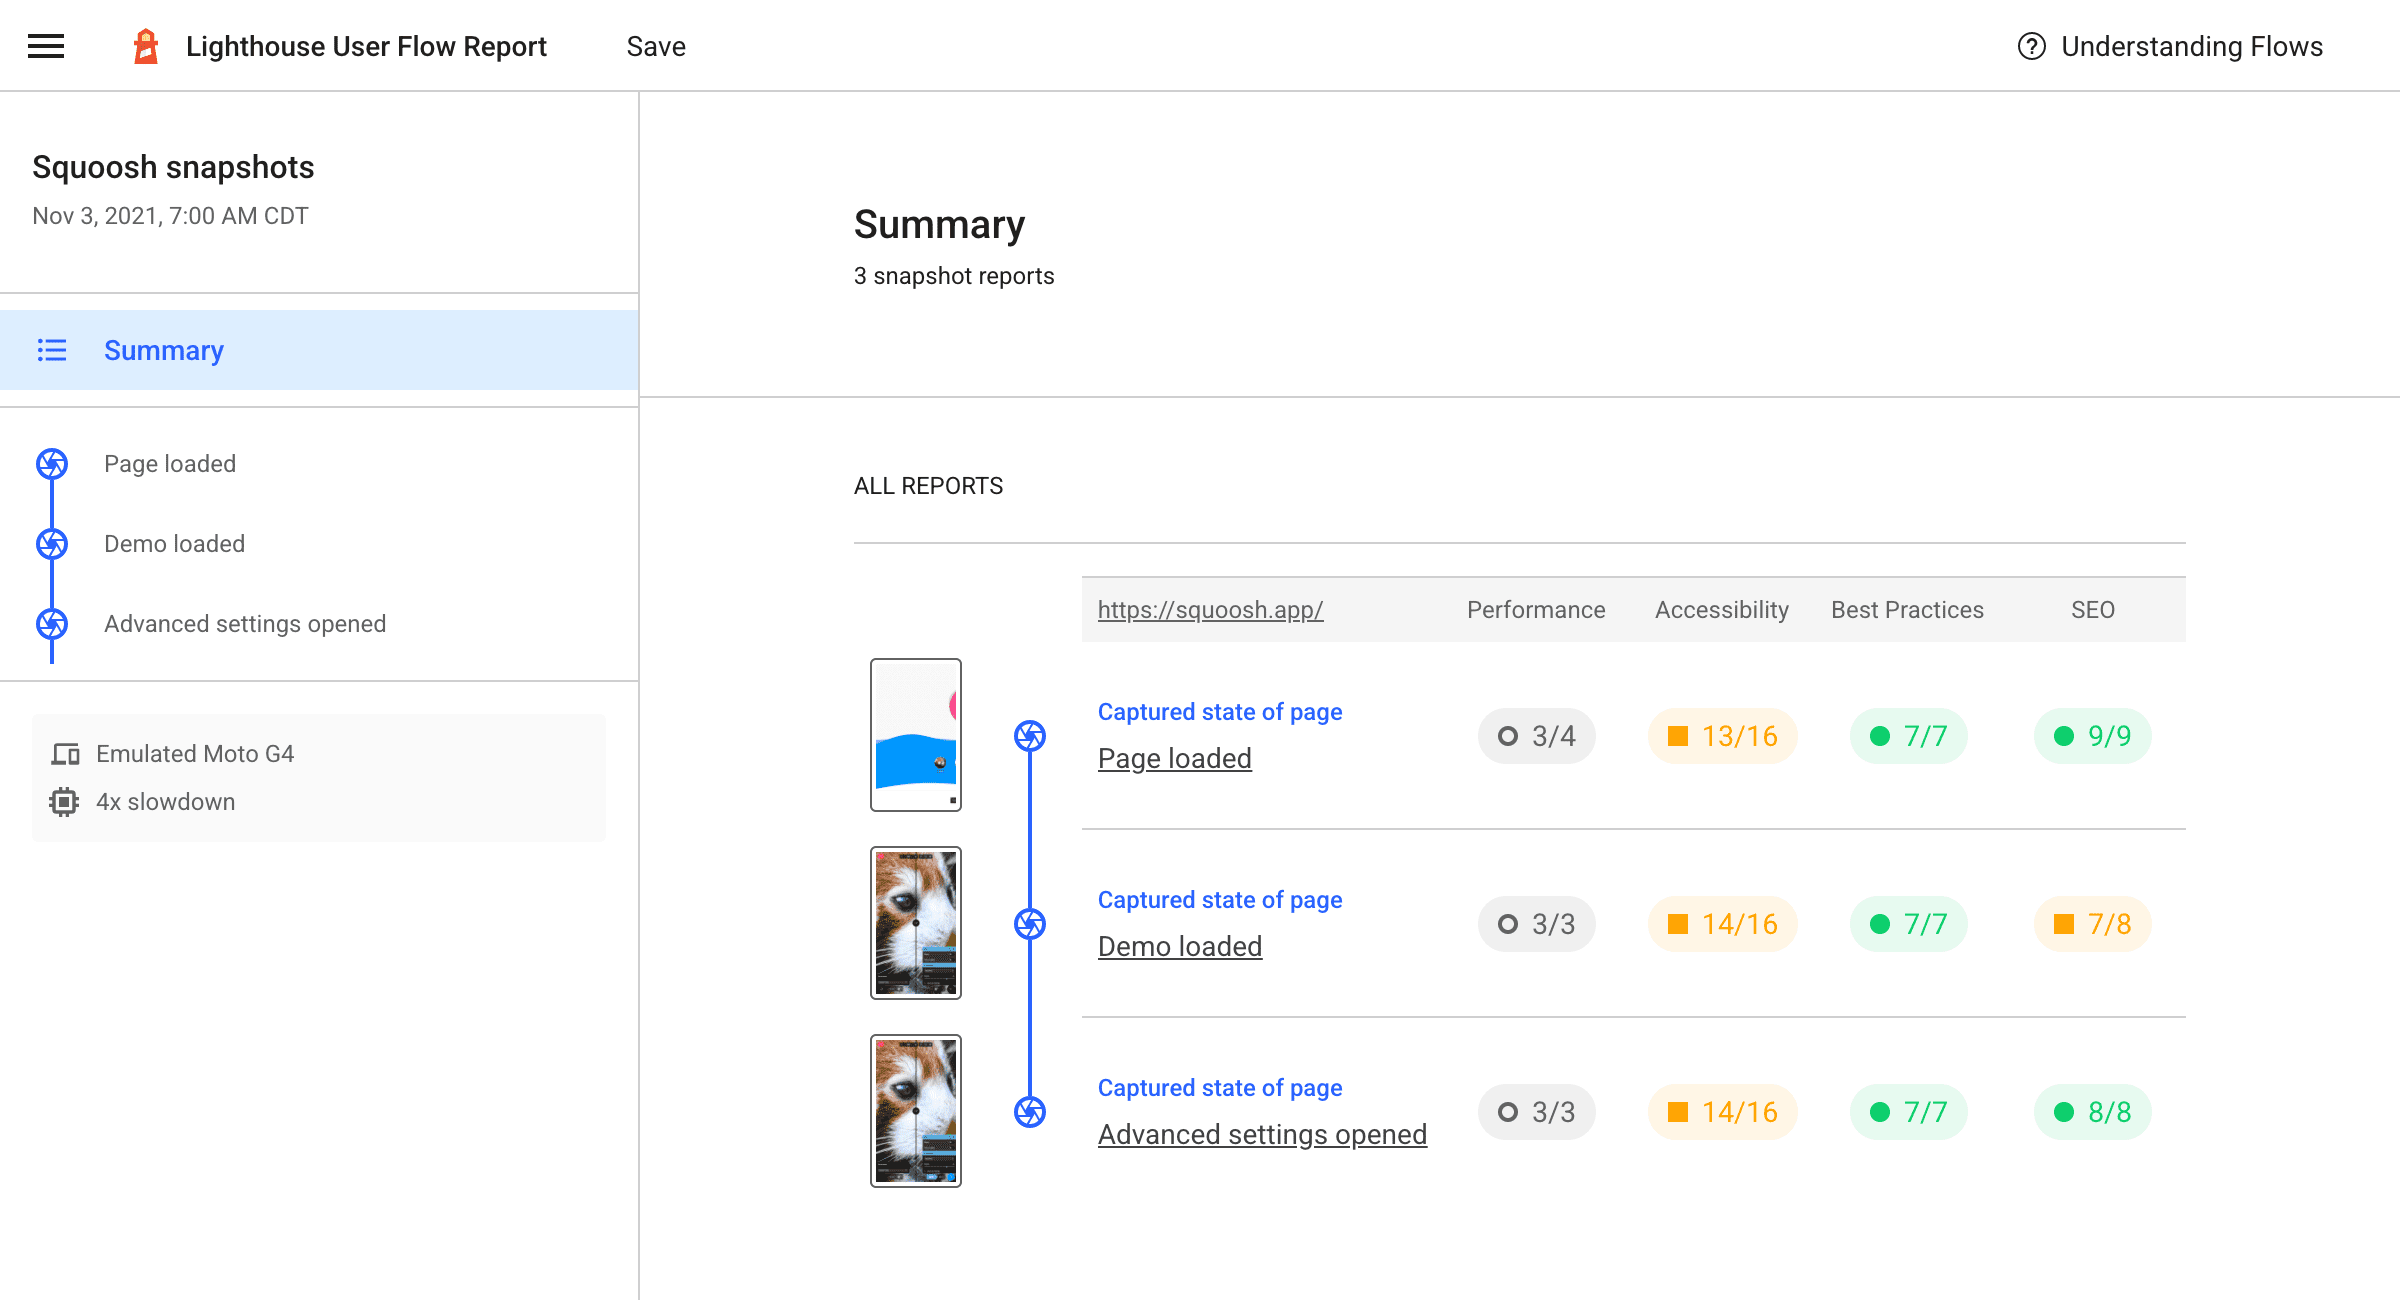
The resulting report shows that results are generally good, but there may be some accessibility criteria that need to be checked out manually:
Timespans
One of the biggest differences between performance results in the field (like from CrUX) and in the lab (like from Lighthouse) is the lack of user input. This is where a timespan—the last user flow mode—can help.
A timespan runs Lighthouse audits over some period of time, which may or may not include a navigation. This is a great way to capture what's going on with a page during interactions. For instance, by default Lighthouse measures CLS during page load, but in the field, CLS is measured from initial navigation until the page is closed. If user interactions are the trigger of CLS, this is something Lighthouse previously wouldn't be able to catch and help fix.
To demonstrate this, here is a test site that simulates ads being injected into an article during scroll without space having been reserved for them. In a long series of cards, an occasional red square is added when its slot enters the viewport. Since space was not reserved for these red squares, the cards below them are shifted out of the way, causing layout shifts.
A regular Lighthouse navigation will have a CLS of 0. However, once scrolled, the page will have problematic layout shifts and the CLS value will rise.
The following script will produce a user flow report with both actions, to show the difference.
async function captureReport() {
  const browser = await puppeteer.launch({headless: false});
  const page = await browser.newPage();
  // Get a session handle to be able to send protocol commands to the page.
  const session = await page.target().createCDPSession();

  const testUrl = 'https://pie-charmed-treatment.glitch.me/';
  const flow = await startFlow(page, {name: 'CLS during navigation and on scroll'});

  // Regular Lighthouse navigation.
  await flow.navigate(testUrl, {stepName: 'Navigate only'});

  // Navigate and scroll timespan.
  await flow.startTimespan({stepName: 'Navigate and scroll'});
  await page.goto(testUrl, {waitUntil: 'networkidle0'});
  // We need the ability to scroll like a user. There's not a direct puppeteer function for this, but we can use the DevTools Protocol and issue a Input.synthesizeScrollGesture event, which has convenient parameters like repetitions and delay to somewhat simulate a more natural scrolling gesture.
  // https://chromedevtools.github.io/devtools-protocol/tot/Input/#method-synthesizeScrollGesture
  await session.send('Input.synthesizeScrollGesture', {
    x: 100,
    y: 600,
    yDistance: -2500,
    speed: 1000,
    repeatCount: 2,
    repeatDelayMs: 250,
  });
  await flow.endTimespan();

  await browser.close();

  const report = await flow.generateReport();
  fs.writeFileSync('flow.report.html', report);
  open('flow.report.html', {wait: false});
}

captureReport();
This generates a report comparing a regular navigation to a timespan which contains both a navigation and scrolling afterwards:
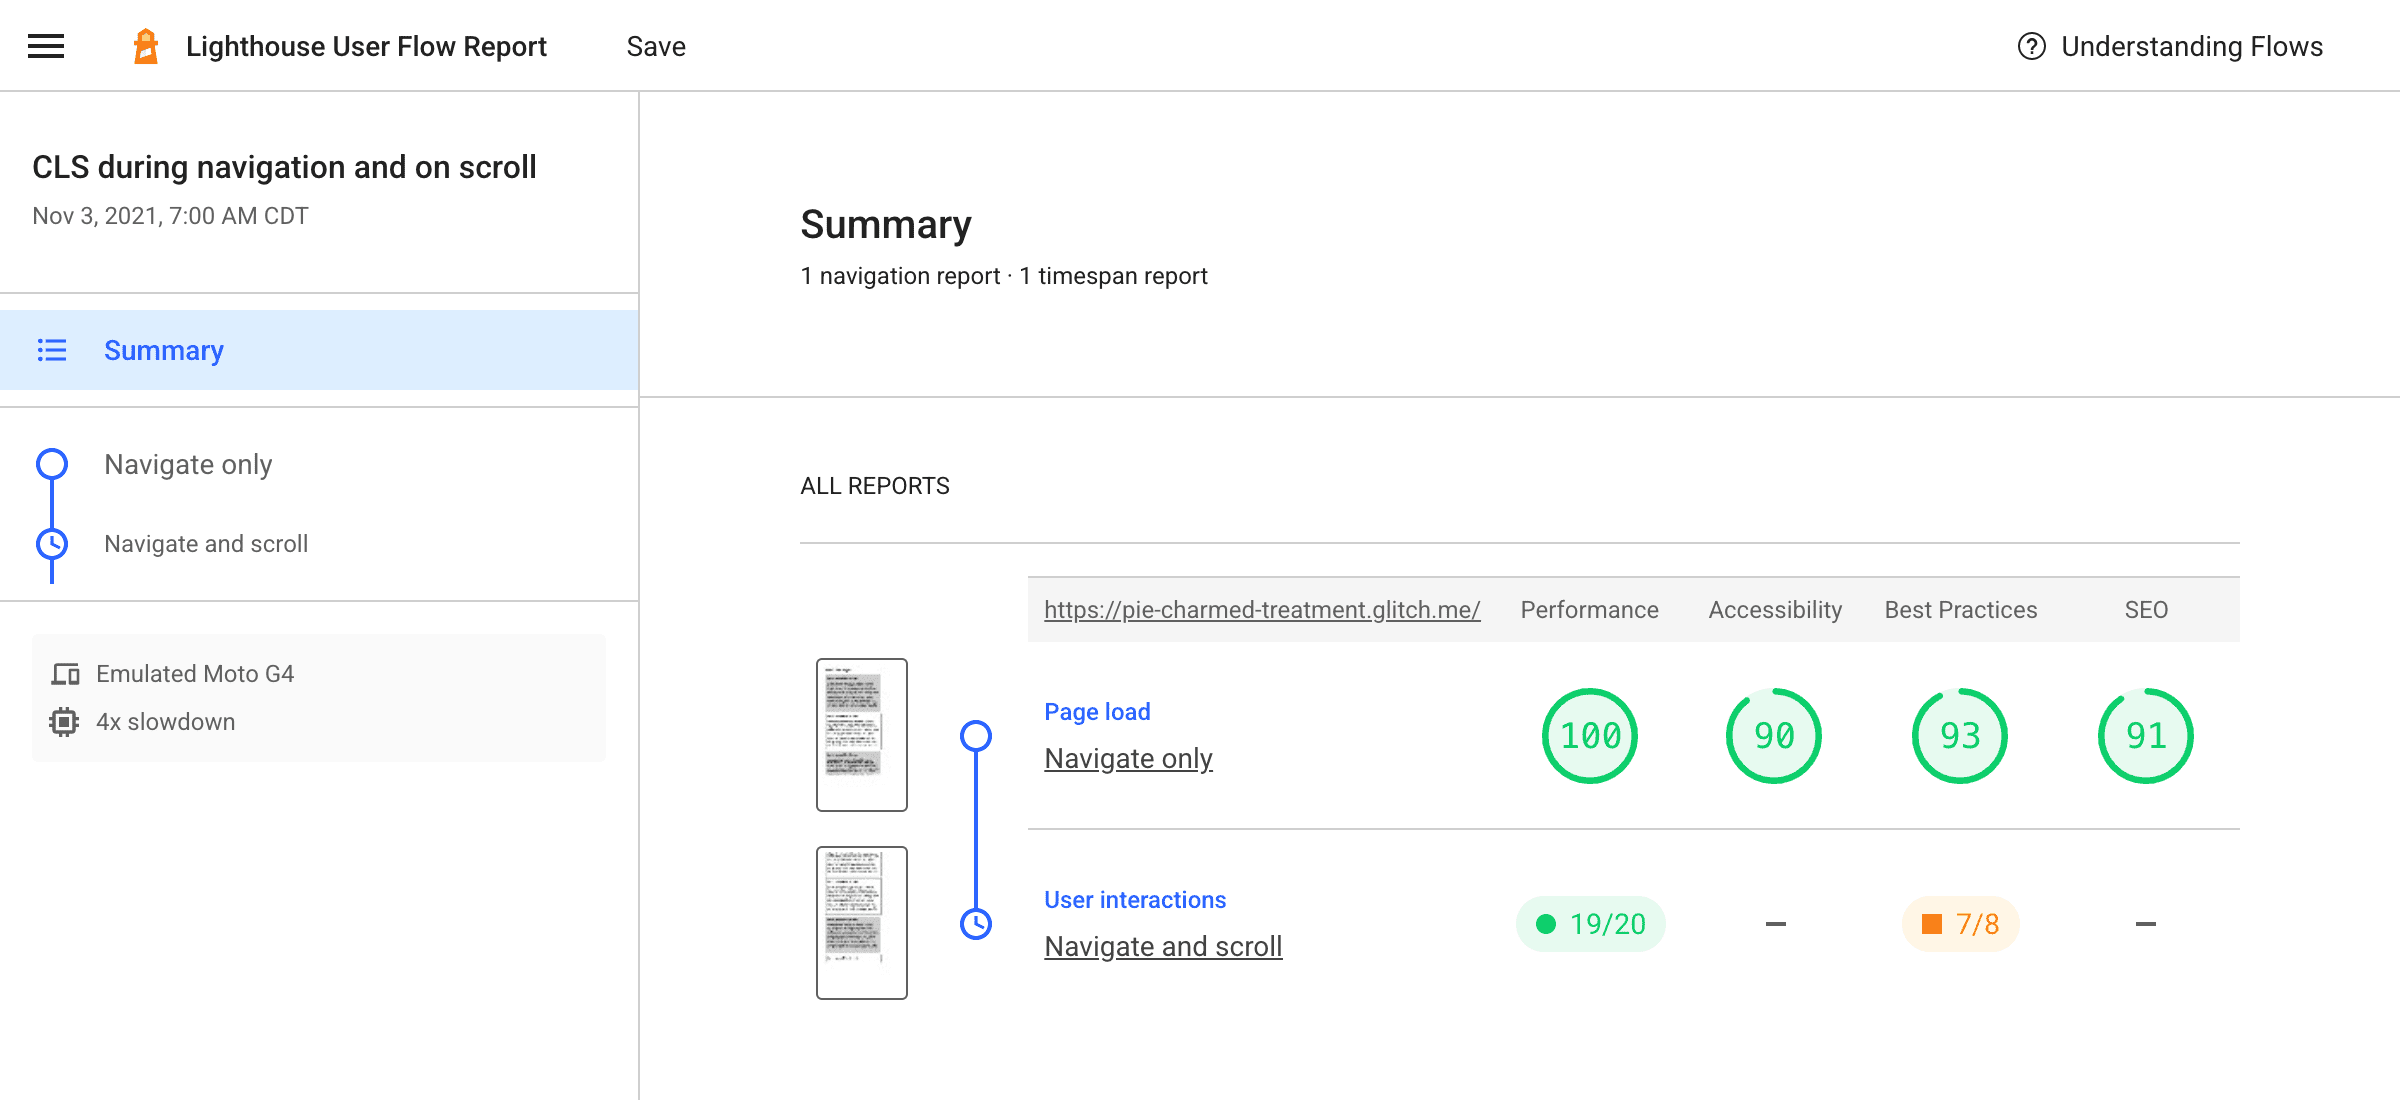
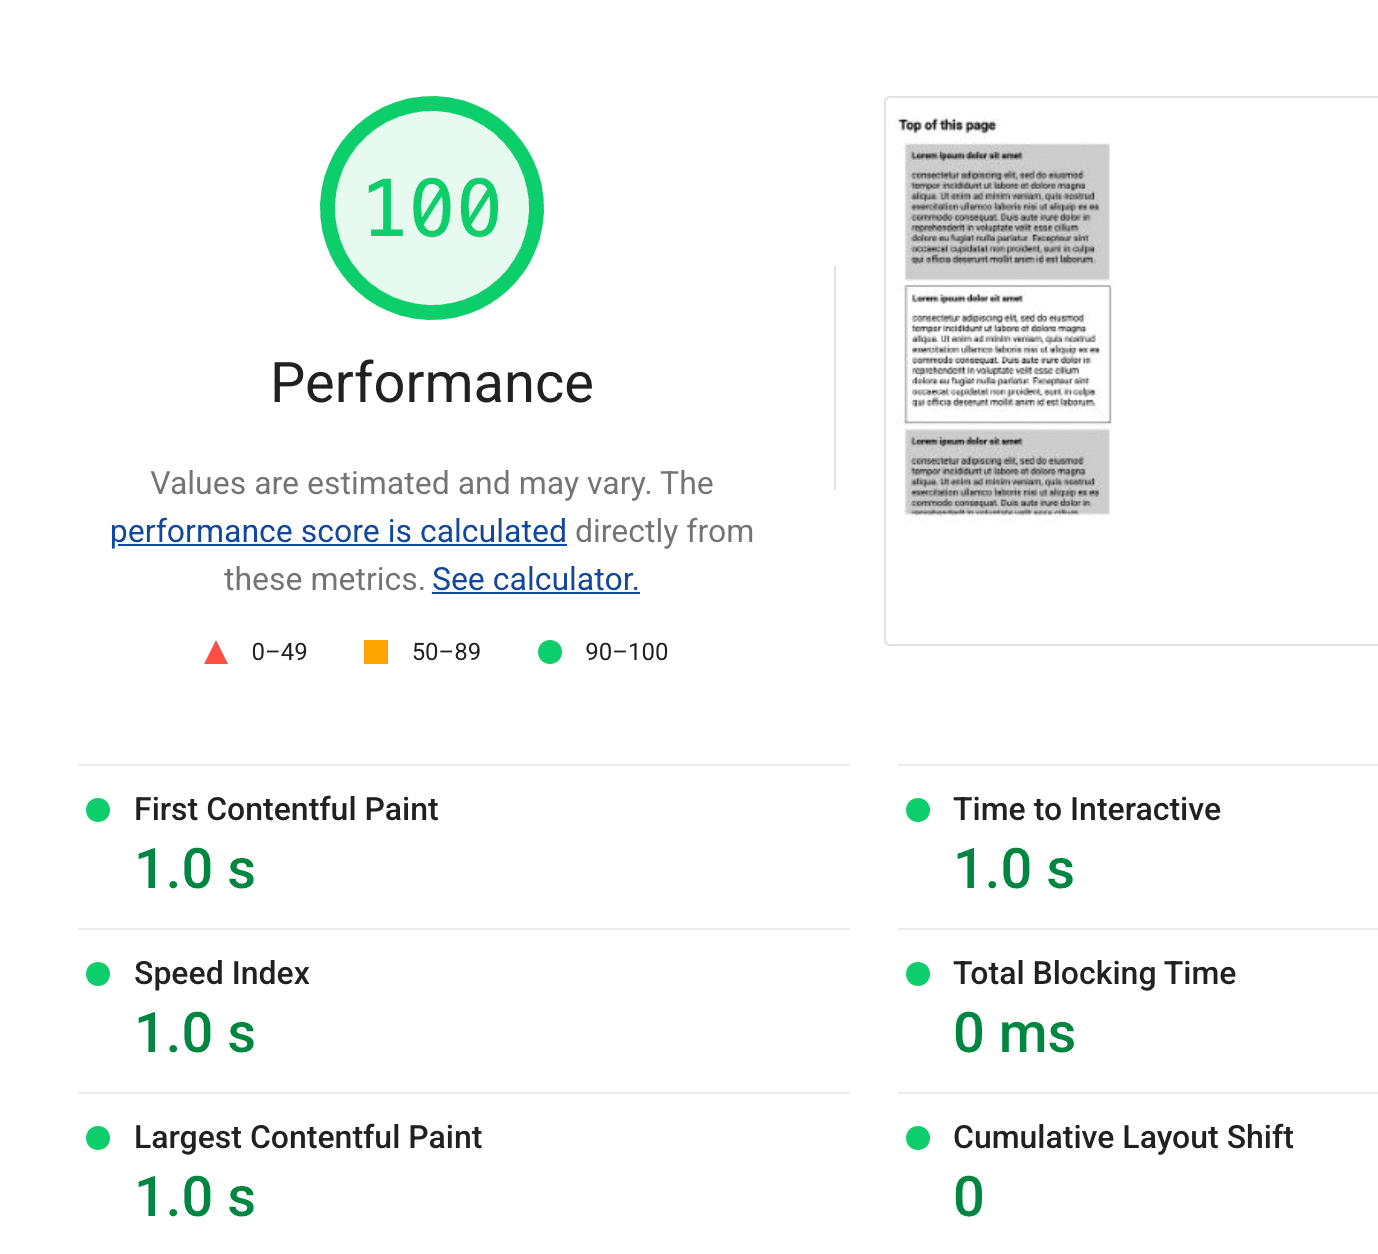
Digging into each step, the navigation-only step shows a CLS of 0. Great site!
However the "Navigate and scroll" step tells a different story. Currently only Total Blocking Time and Cumulative Layout Shift are available in timespans, but the lazy-loaded content on this page clearly tanks the CLS for the site.
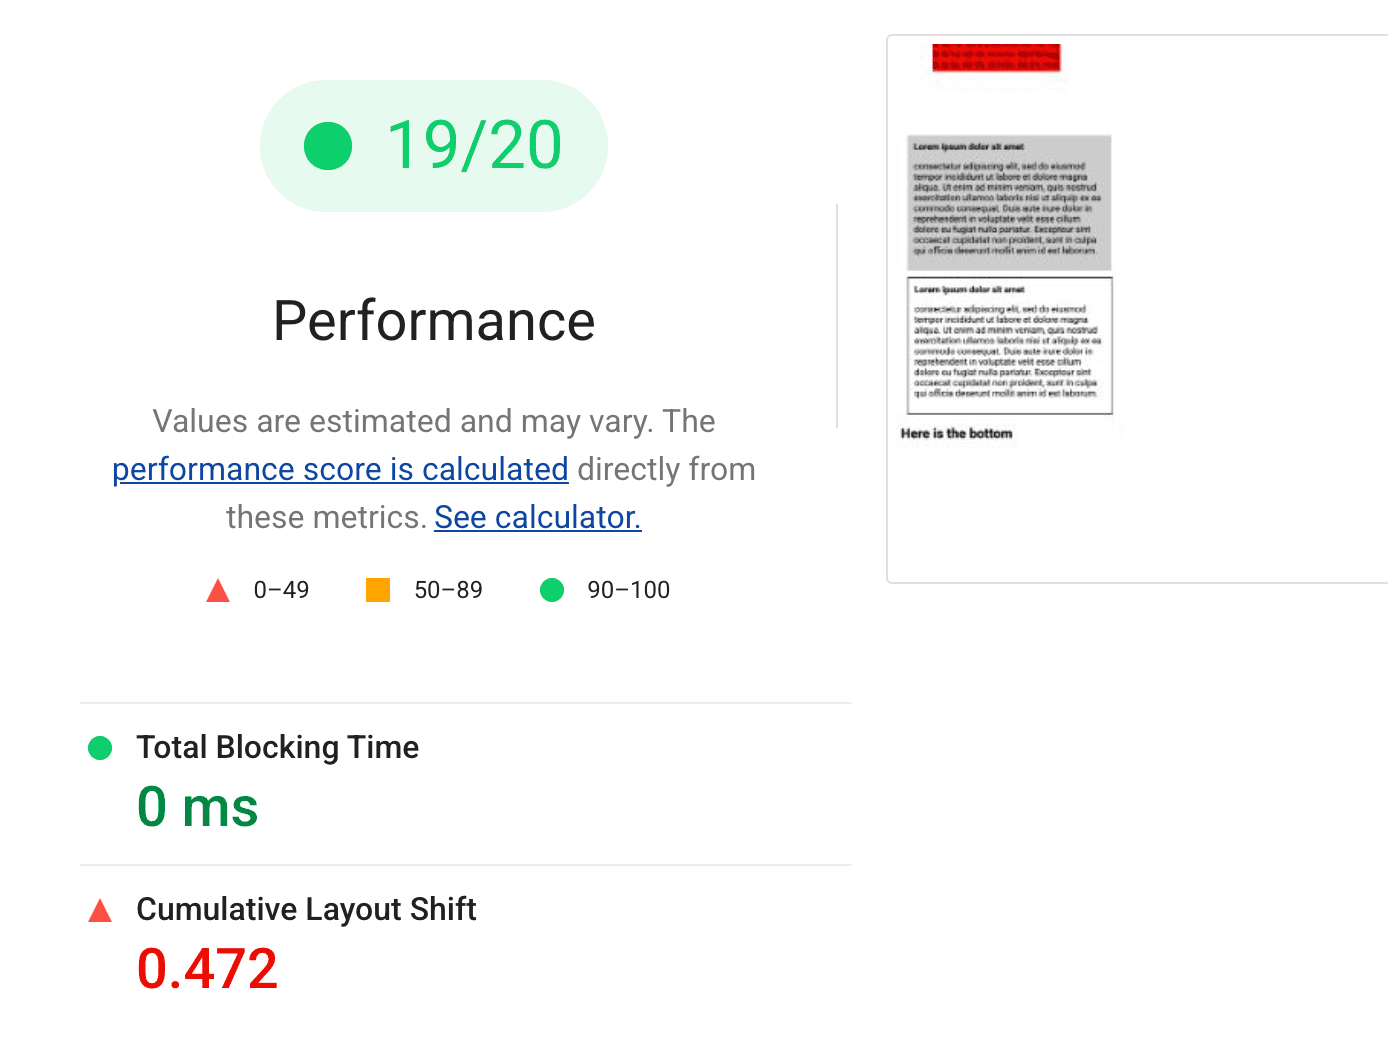
Formerly, Lighthouse would not be able to identify this problematic CLS behavior, though it would almost certainly show up in the experience of real users. Performance testing over scripted interactions improves lab fidelity significantly.
Looking for feedback
The new user flow APIs in Lighthouse can do many new things, but it may still be complicated to measure the kind of scenarios your users encounter.
Please reach out with any questions in the Lighthouse discussion forums, and file any bugs or suggestions in the issue tracker.

