Learn how to send Web Vitals data to Google Analytics 4 properties and export the data for analysis in BigQuery and Looker Studio.
Google provides a number of tools—Search Console, PageSpeed Insights (PSI), and the Chrome User Experience Report (CrUX)—that let developers see how their sites perform against the Core Web Vitals metrics for their real users in the field.
These tools are great in that they give you a high-level view of your site's real-user performance, and they require absolutely no setup to start using.
However, there are a few critical reasons why you don't want to rely on these tools alone to measure your site's performance:
- CrUX-based tools report data by either monthly or previous 28-day periods. This means you'll have to wait a long time after making any changes before you can see the results.
- CrUX-based tools can only be segment by a limited number of dimensions, such as country, connection type, and device category (desktop or mobile). You can't slice the data by dimensions specific to your business (for example: engaged users, users in a particular experiment group, etc.).
- CrUX-based tools can tell you what your performance is, but they can't tell you why. With analytics tools you can send additional data to help you track down and debug issues.
For these reasons, we recommend all site owners monitor Core Web Vitals metrics using their existing analytics tool. This post explains how you can use free tools offered by Google to do just that.
Once you have everything set up, you'll be able to create dashboards like these:
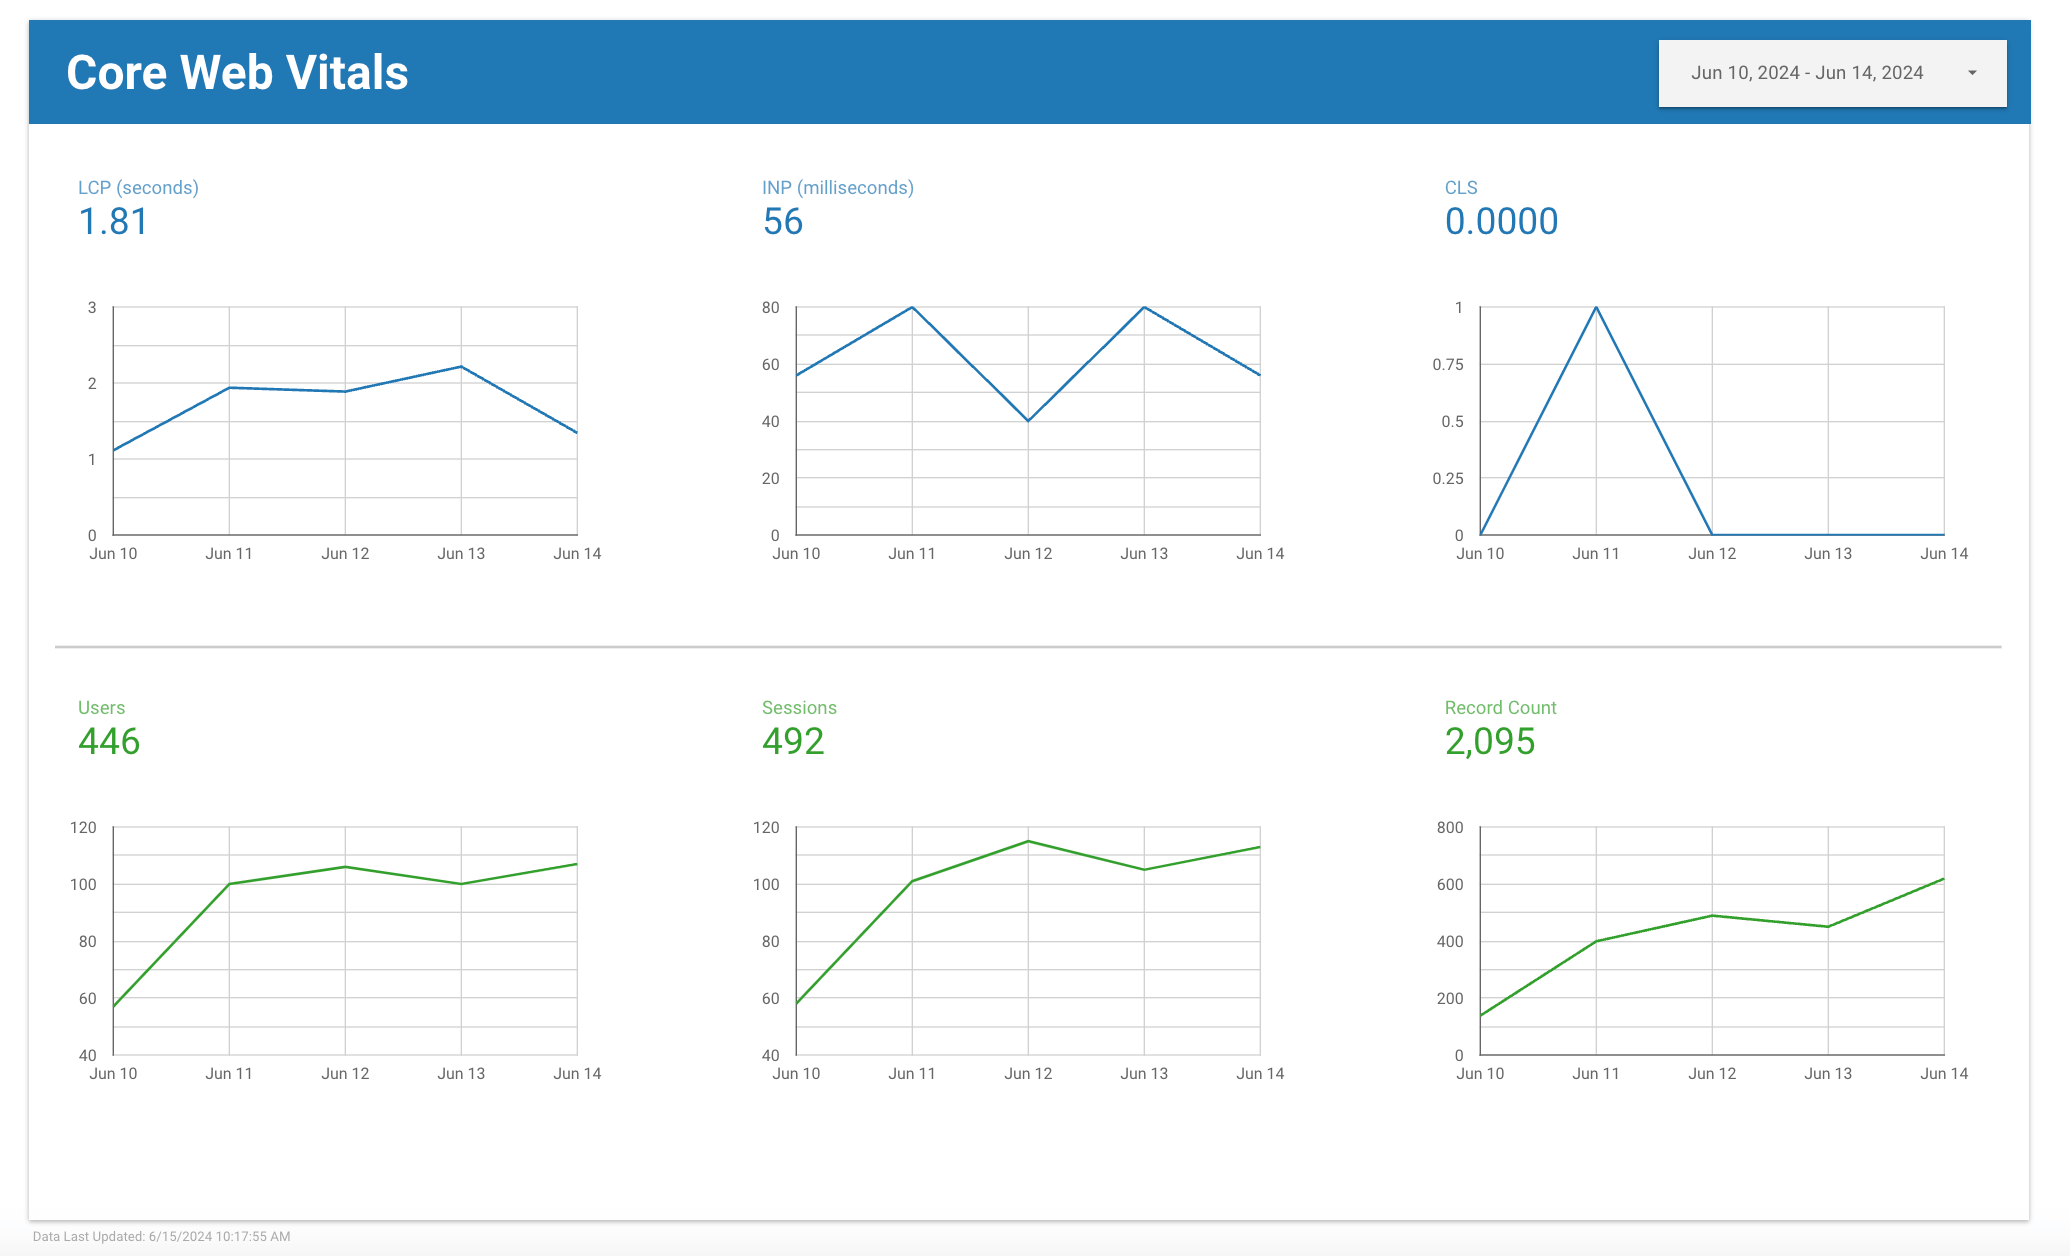
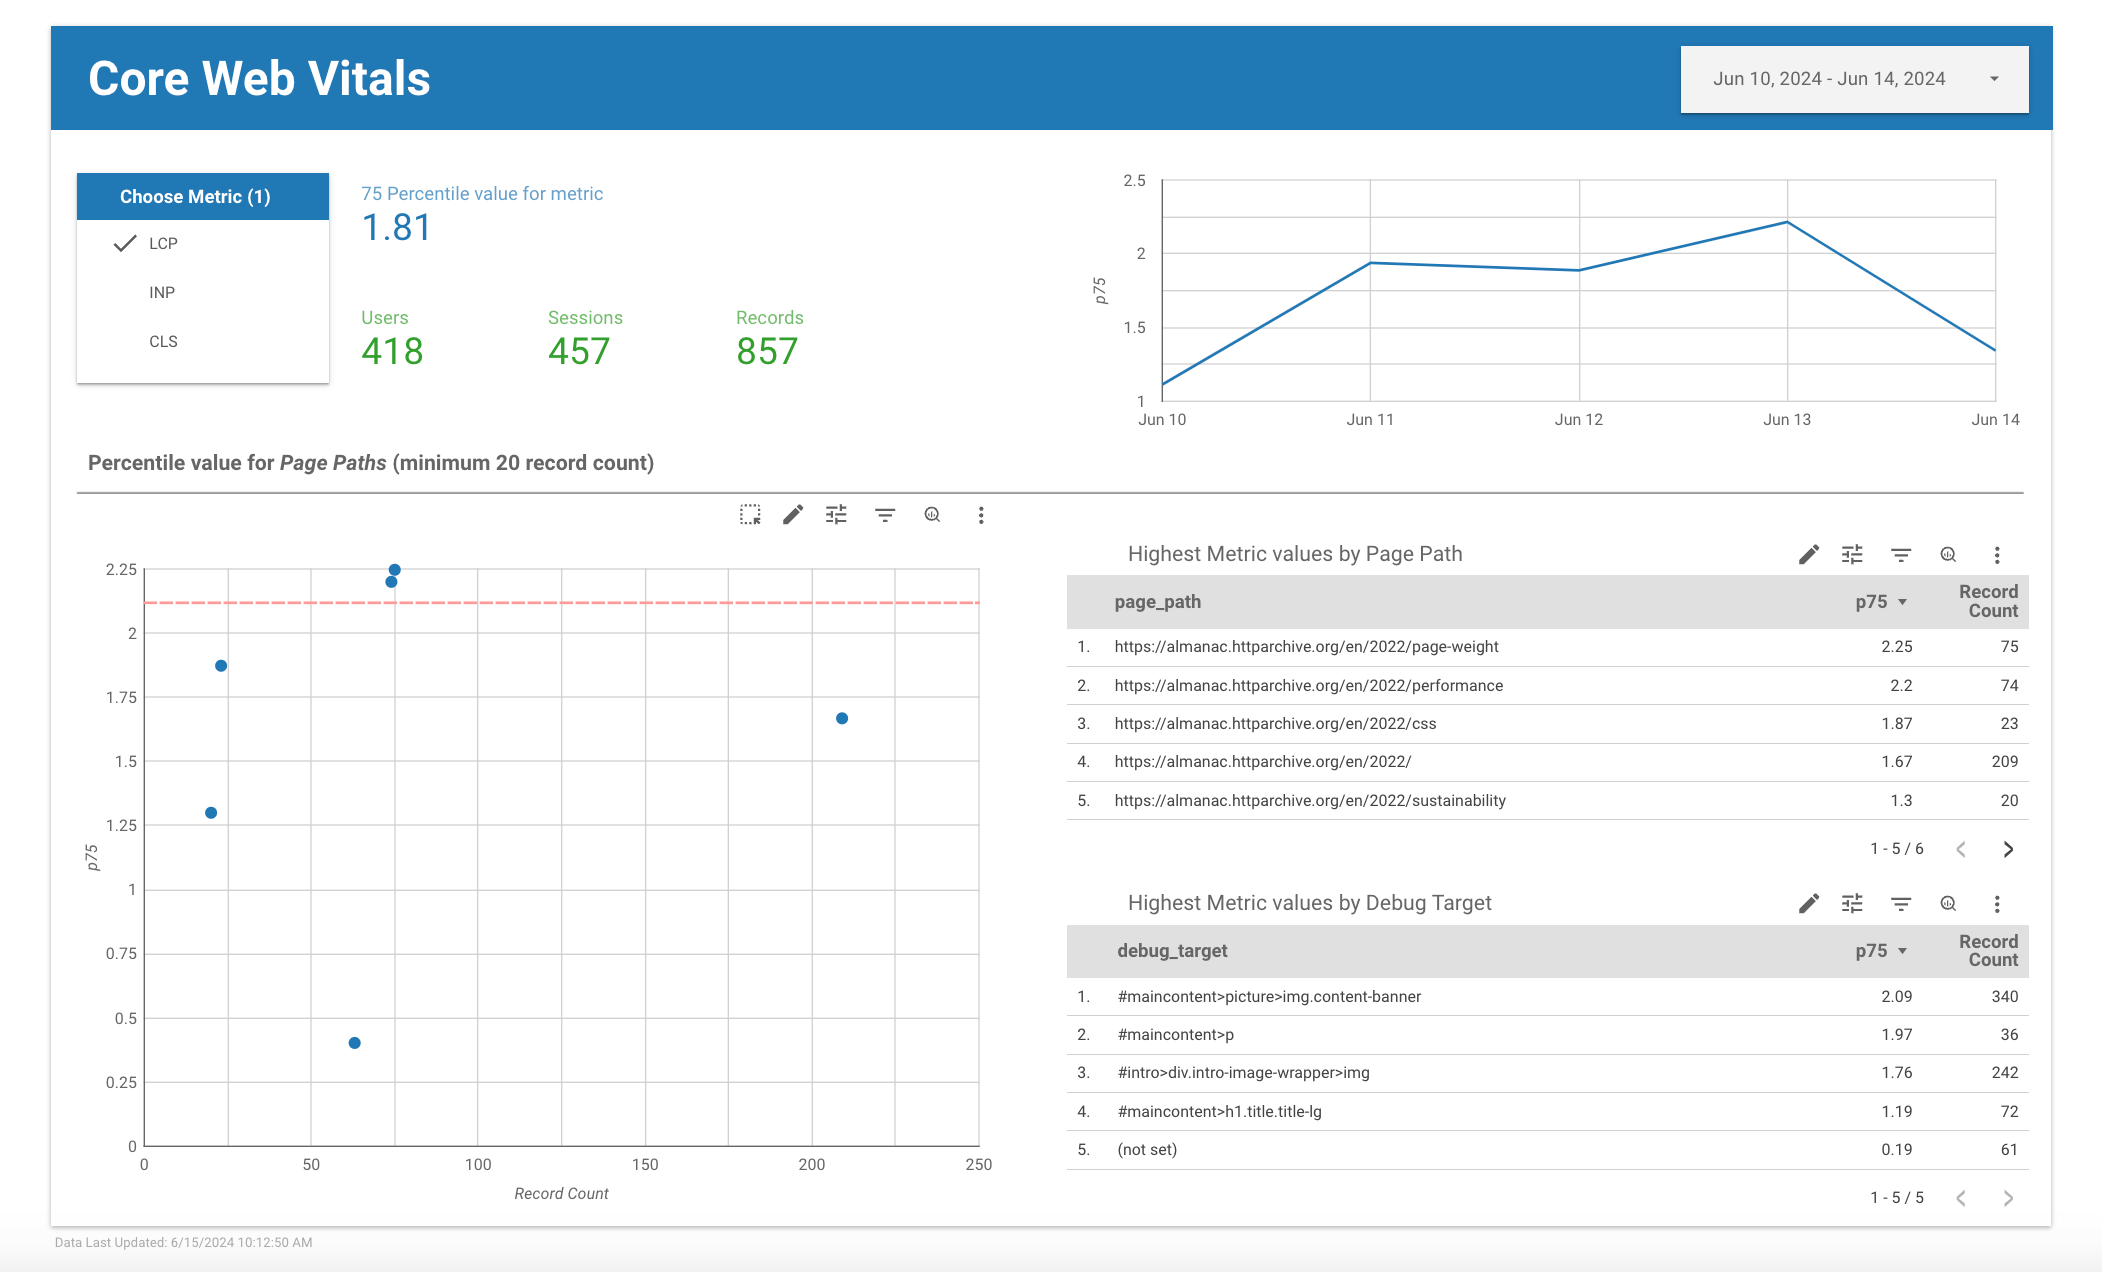
And If you want a visual overview of all the steps outlined here, check out our talk from Google I/O '21:
Measure
Measuring performance has always been possible with Google Analytics using custom metrics, but there are a few new features in Google Analytics 4 (GA4) that developers in particular should be excited about.
- Zero-config, custom event parameters
- Free BigQuery export, so you can query your data using SQL
While the Google Analytics web interface does have powerful analysis tools, it's hard to beat the power and flexibility of raw event data access using a query language you likely already know.
To get started measuring Core Web Vitals using Google Analytics 4 and BigQuery, you need to do three things:
- Create a Google Analytics 4 property and a BigQuery project.
- Enable BigQuery export in your Google Analytics property config, so all data you receive will be automatically populated in your BigQuery project tables.
- Add the web-vitals JavaScript library to your site, so you can measure the Core Web Vitals metrics and send the data to Google Analytics 4, including the attribution data.
Analyze
Once you're all set up, you should see event data populating in the BigQuery interface, and you should be able to query the data like this:
SELECT * FROM `my_project_id.analytics_XXXXX.events_*`
WHERE event_name IN ('LCP', 'INP', 'CLS')
Here's a preview of the results from that query:
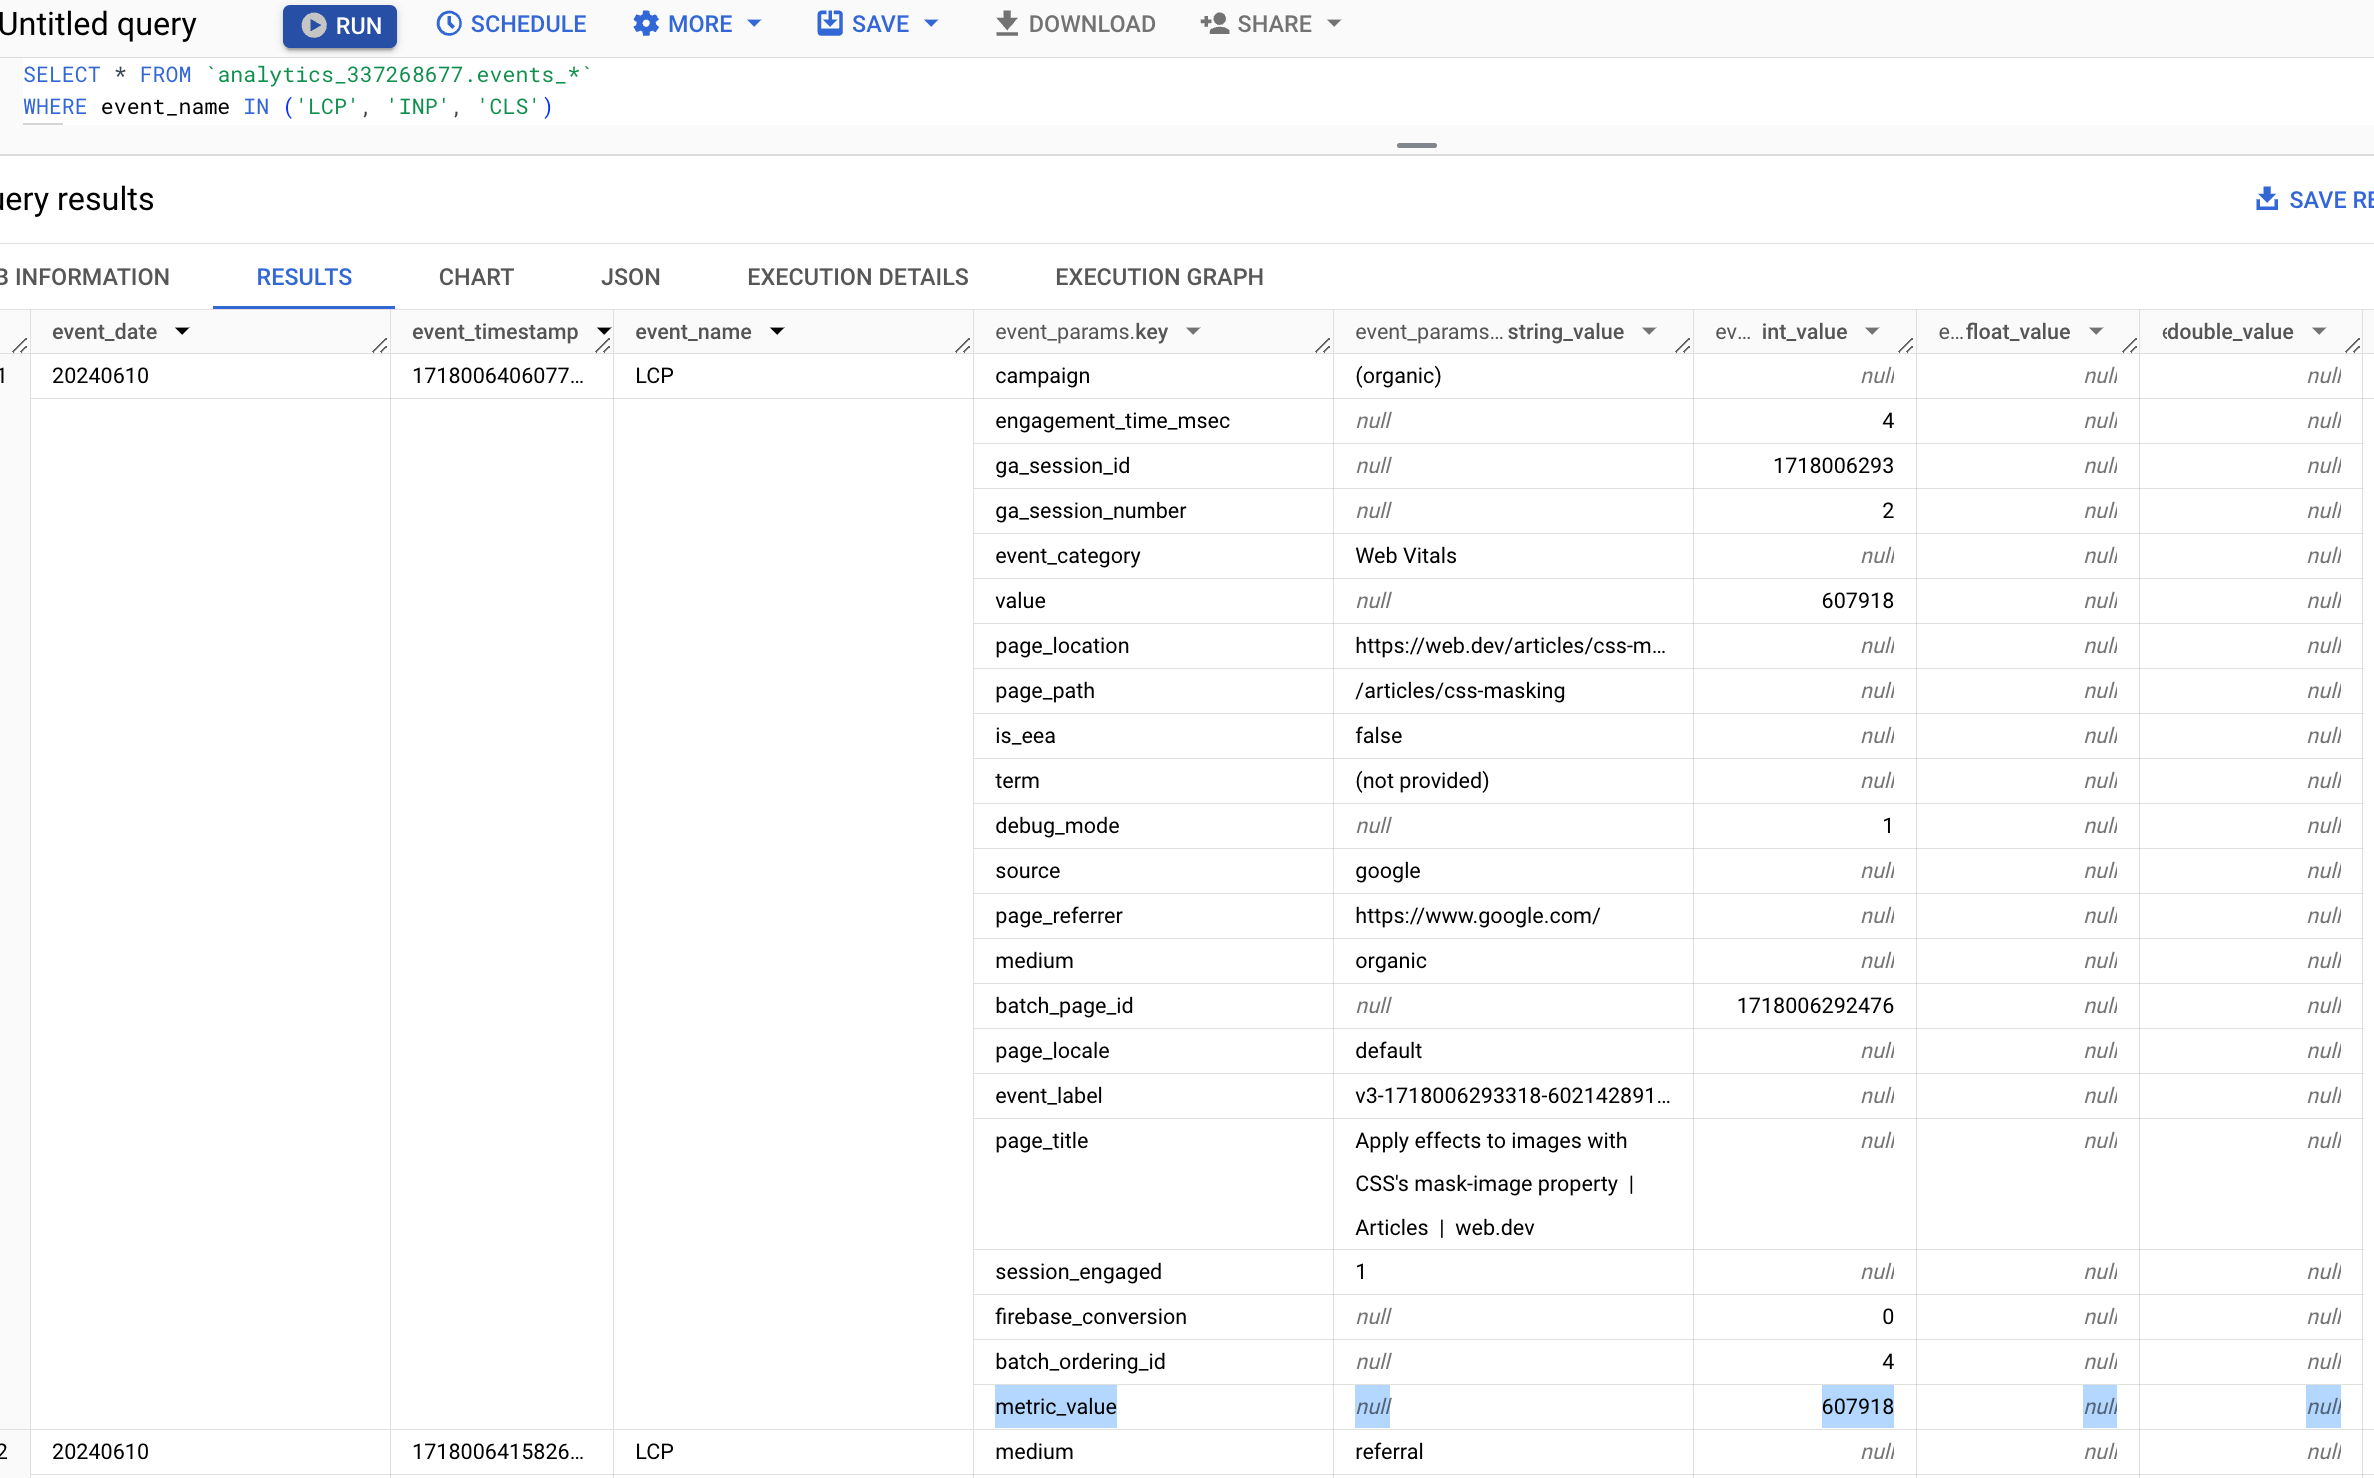
Query Web Vitals data
Before you start querying your Web Vitals event data, it's important to understand how the data is aggregated.
The most important thing to understand is that, in some cases, multiple events may be received for the same metric, on the same page. This can happen if the metric value changes and an updated value is reported (a common occurrence with CLS).
For Web Vitals events, the last value sent is always the most accurate one, so before performing any analysis, it's important to filter for just those values. The code snippet provided by the web-vitals JavaScript library to send data to Google Analytics 4 includes sending a unique ID per metric, so you can use the following query to limit your results to just the last-received value for each metric ID:
# Subquery all Web Vitals events from the last 28 days
WITH web_vitals_events AS (
  SELECT event_name as metric_name, * EXCEPT(event_name, is_last_received_value) FROM (
    SELECT *, ROW_NUMBER() OVER (
      PARTITION BY (SELECT value.string_value FROM UNNEST(event_params) WHERE key = 'metric_id') ORDER BY (SELECT value.int_value FROM UNNEST(event_params) WHERE key = 'metric_start_time') DESC
    ) = 1 AS is_last_received_value
    FROM `bigquery_project_id.analytics_XXXXX.events_*`
    WHERE event_name in ('CLS', 'INP', 'LCP') AND
      _TABLE_SUFFIX BETWEEN FORMAT_DATE('%Y%m%d', DATE_SUB(CURRENT_DATE, INTERVAL 28 DAY)) AND FORMAT_DATE('%Y%m%d', DATE_SUB(CURRENT_DATE, INTERVAL 1 DAY))
  ) WHERE is_last_received_value
)
Note that all other queries referenced in this post will start with this subquery.
Example queries
The next few sections show a few examples of common Web Vitals queries you might want to run.
LCP, INP, and CLS at the 75% percentile (p75) across the whole site
# Subquery all Web Vitals events from the last 28 days
WITH web_vitals_events AS (
  SELECT event_name as metric_name, * EXCEPT(event_name, is_last_received_value) FROM (
    SELECT *, ROW_NUMBER() OVER (
      PARTITION BY (SELECT value.string_value FROM UNNEST(event_params) WHERE key = 'metric_id') ORDER BY (SELECT value.int_value FROM UNNEST(event_params) WHERE key = 'metric_start_time') DESC
    ) = 1 AS is_last_received_value
    FROM `bigquery_project_id.analytics_XXXXX.events_*`
    WHERE event_name in ('CLS', 'INP', 'LCP') AND
      _TABLE_SUFFIX BETWEEN FORMAT_DATE('%Y%m%d', DATE_SUB(CURRENT_DATE, INTERVAL 28 DAY)) AND FORMAT_DATE('%Y%m%d', DATE_SUB(CURRENT_DATE, INTERVAL 1 DAY))
  ) WHERE is_last_received_value
)
# Main query logic
SELECT
  metric_name,
  APPROX_QUANTILES(metric_value, 100)[OFFSET(75)] AS p75,
  COUNT(1) as count
FROM (
  SELECT
    metric_name,
    ROUND((SELECT COALESCE(value.double_value, value.int_value) FROM UNNEST(event_params) WHERE key = "metric_value"), 3) AS metric_value,
  FROM web_vitals_events
)
GROUP BY 1
All individual LCP values from highest to lowest
# Subquery all Web Vitals events from the last 28 days
WITH web_vitals_events AS (
  SELECT event_name as metric_name, * EXCEPT(event_name, is_last_received_value) FROM (
    SELECT *, ROW_NUMBER() OVER (
      PARTITION BY (SELECT value.string_value FROM UNNEST(event_params) WHERE key = 'metric_id') ORDER BY (SELECT value.int_value FROM UNNEST(event_params) WHERE key = 'metric_start_time') DESC
    ) = 1 AS is_last_received_value
    FROM `bigquery_project_id.analytics_XXXXX.events_*`
    WHERE event_name in ('CLS', 'INP', 'LCP') AND
      _TABLE_SUFFIX BETWEEN FORMAT_DATE('%Y%m%d', DATE_SUB(CURRENT_DATE, INTERVAL 28 DAY)) AND FORMAT_DATE('%Y%m%d', DATE_SUB(CURRENT_DATE, INTERVAL 1 DAY))
  ) WHERE is_last_received_value
)
# Main query logic
SELECT
  ROUND((SELECT COALESCE(value.double_value, value.int_value) FROM UNNEST(event_params) WHERE key = "metric_value"), 3) AS metric_value,
FROM web_vitals_events
WHERE metric_name = 'LCP'
ORDER BY metric_value DESC
LCP scores (p75) of the 10 most popular pages
# Subquery all Web Vitals events from the last 28 days
WITH web_vitals_events AS (
  SELECT event_name as metric_name, * EXCEPT(event_name, is_last_received_value) FROM (
    SELECT *, ROW_NUMBER() OVER (
      PARTITION BY (SELECT value.string_value FROM UNNEST(event_params) WHERE key = 'metric_id') ORDER BY (SELECT value.int_value FROM UNNEST(event_params) WHERE key = 'metric_start_time') DESC
    ) = 1 AS is_last_received_value
    FROM `bigquery_project_id.analytics_XXXXX.events_*`
    WHERE event_name in ('CLS', 'INP', 'LCP') AND
      _TABLE_SUFFIX BETWEEN FORMAT_DATE('%Y%m%d', DATE_SUB(CURRENT_DATE, INTERVAL 28 DAY)) AND FORMAT_DATE('%Y%m%d', DATE_SUB(CURRENT_DATE, INTERVAL 1 DAY))
  ) WHERE is_last_received_value
)
# Main query logic
SELECT
  page_path,
  APPROX_QUANTILES(metric_value, 100)[OFFSET(75)] AS LCP,
  COUNT(1) as count
FROM (
  SELECT
    REGEXP_SUBSTR((SELECT value.string_value FROM UNNEST(event_params) WHERE key = "page_location"), r'\.com(\/[^?]*)') AS page_path,
    ROUND((SELECT COALESCE(value.double_value, value.int_value) FROM UNNEST(event_params) WHERE key = "metric_value"), 3) AS metric_value,
  FROM web_vitals_events
  WHERE metric_name = 'LCP'
)
GROUP BY 1
ORDER BY count DESC
LIMIT 10
Top 10 pages with the worst CLS (p75)
# Subquery all Web Vitals events from the last 28 days
WITH web_vitals_events AS (
  SELECT event_name as metric_name, * EXCEPT(event_name, is_last_received_value) FROM (
    SELECT *, ROW_NUMBER() OVER (
      PARTITION BY (SELECT value.string_value FROM UNNEST(event_params) WHERE key = 'metric_id') ORDER BY (SELECT value.int_value FROM UNNEST(event_params) WHERE key = 'metric_start_time') DESC
    ) = 1 AS is_last_received_value
    FROM `bigquery_project_id.analytics_XXXXX.events_*`
    WHERE event_name in ('CLS', 'INP', 'LCP') AND
      _TABLE_SUFFIX BETWEEN FORMAT_DATE('%Y%m%d', DATE_SUB(CURRENT_DATE, INTERVAL 28 DAY)) AND FORMAT_DATE('%Y%m%d', DATE_SUB(CURRENT_DATE, INTERVAL 1 DAY))
  ) WHERE is_last_received_value
)
# Main query logic
SELECT
  page_path,
  APPROX_QUANTILES(metric_value, 100)[OFFSET(75)] AS CLS,
  COUNT(1) as count
FROM (
  SELECT
    REGEXP_SUBSTR((SELECT value.string_value FROM UNNEST(event_params) WHERE key = "page_location"), r'\.com(\/[^?]*)') AS page_path,
    ROUND((SELECT COALESCE(value.double_value, value.int_value) FROM UNNEST(event_params) WHERE key = "metric_value"), 3) AS metric_value,
  FROM web_vitals_events
  WHERE metric_name = 'CLS'
)
GROUP BY 1
HAVING count > 50 # Limit to relatively popular pages
ORDER BY CLS DESC
LIMIT 10
Debug
The previous queries show how to query the Web Vitals metric data, which is helpful for understanding your current performance and how it's trending over time. But what can you do if your performance is worse than expected but you're not sure why?
Knowing what your scores are is not helpful if you're not able to take action and fix the problems.
Debug performance in the field explains how you can send additional debug information with your analytics data. If you follow the instructions detailed in that post, you should see that debug information appear in BigQuery as well.
Example queries
The following queries show how to use the debug_target event parameter to help
identify the root cause of performance issues.
Top elements contributing to CLS
The debug_target is a CSS selector string that corresponds to the element on
the page that is most relevant to the metric value.
With CLS, the debug_target represents the largest element from the largest
layout shift that contributed to the CLS value. If no elements shifted then the
debug_target value will be null.
The following query will list pages from worst to best by their CLS at the 75th
percentile, grouped by debug_target:
# Subquery all Web Vitals events from the last 28 days
WITH web_vitals_events AS (
  SELECT event_name as metric_name, * EXCEPT(event_name, is_last_received_value) FROM (
    SELECT *, ROW_NUMBER() OVER (
      PARTITION BY (SELECT value.string_value FROM UNNEST(event_params) WHERE key = 'metric_id') ORDER BY (SELECT value.int_value FROM UNNEST(event_params) WHERE key = 'metric_start_time') DESC
    ) = 1 AS is_last_received_value
    FROM `bigquery_project_id.analytics_XXXXX.events_*`
    WHERE event_name in ('CLS', 'INP', 'LCP') AND
      _TABLE_SUFFIX BETWEEN FORMAT_DATE('%Y%m%d', DATE_SUB(CURRENT_DATE, INTERVAL 28 DAY)) AND FORMAT_DATE('%Y%m%d', DATE_SUB(CURRENT_DATE, INTERVAL 1 DAY))
  ) WHERE is_last_received_value
)
# Main query logic
SELECT
  page_path,
  debug_target,
  APPROX_QUANTILES(metric_value, 100)[OFFSET(75)] AS CLS,
  COUNT(1) as count
FROM (
  SELECT
    REGEXP_SUBSTR((SELECT value.string_value FROM UNNEST(event_params) WHERE key = "page_location"), r'\.com(\/[^?]*)') AS page_path,
    (SELECT value.string_value FROM UNNEST(event_params) WHERE key = "debug_target") as debug_target,
    ROUND((SELECT COALESCE(value.double_value, value.int_value) FROM UNNEST(event_params) WHERE key = "metric_value"), 3) AS metric_value,
    *
  FROM web_vitals_events
  WHERE metric_name = 'CLS'
)
GROUP BY 1, 2
HAVING count > 50 # Limit to relatively popular pages
ORDER BY CLS DESC
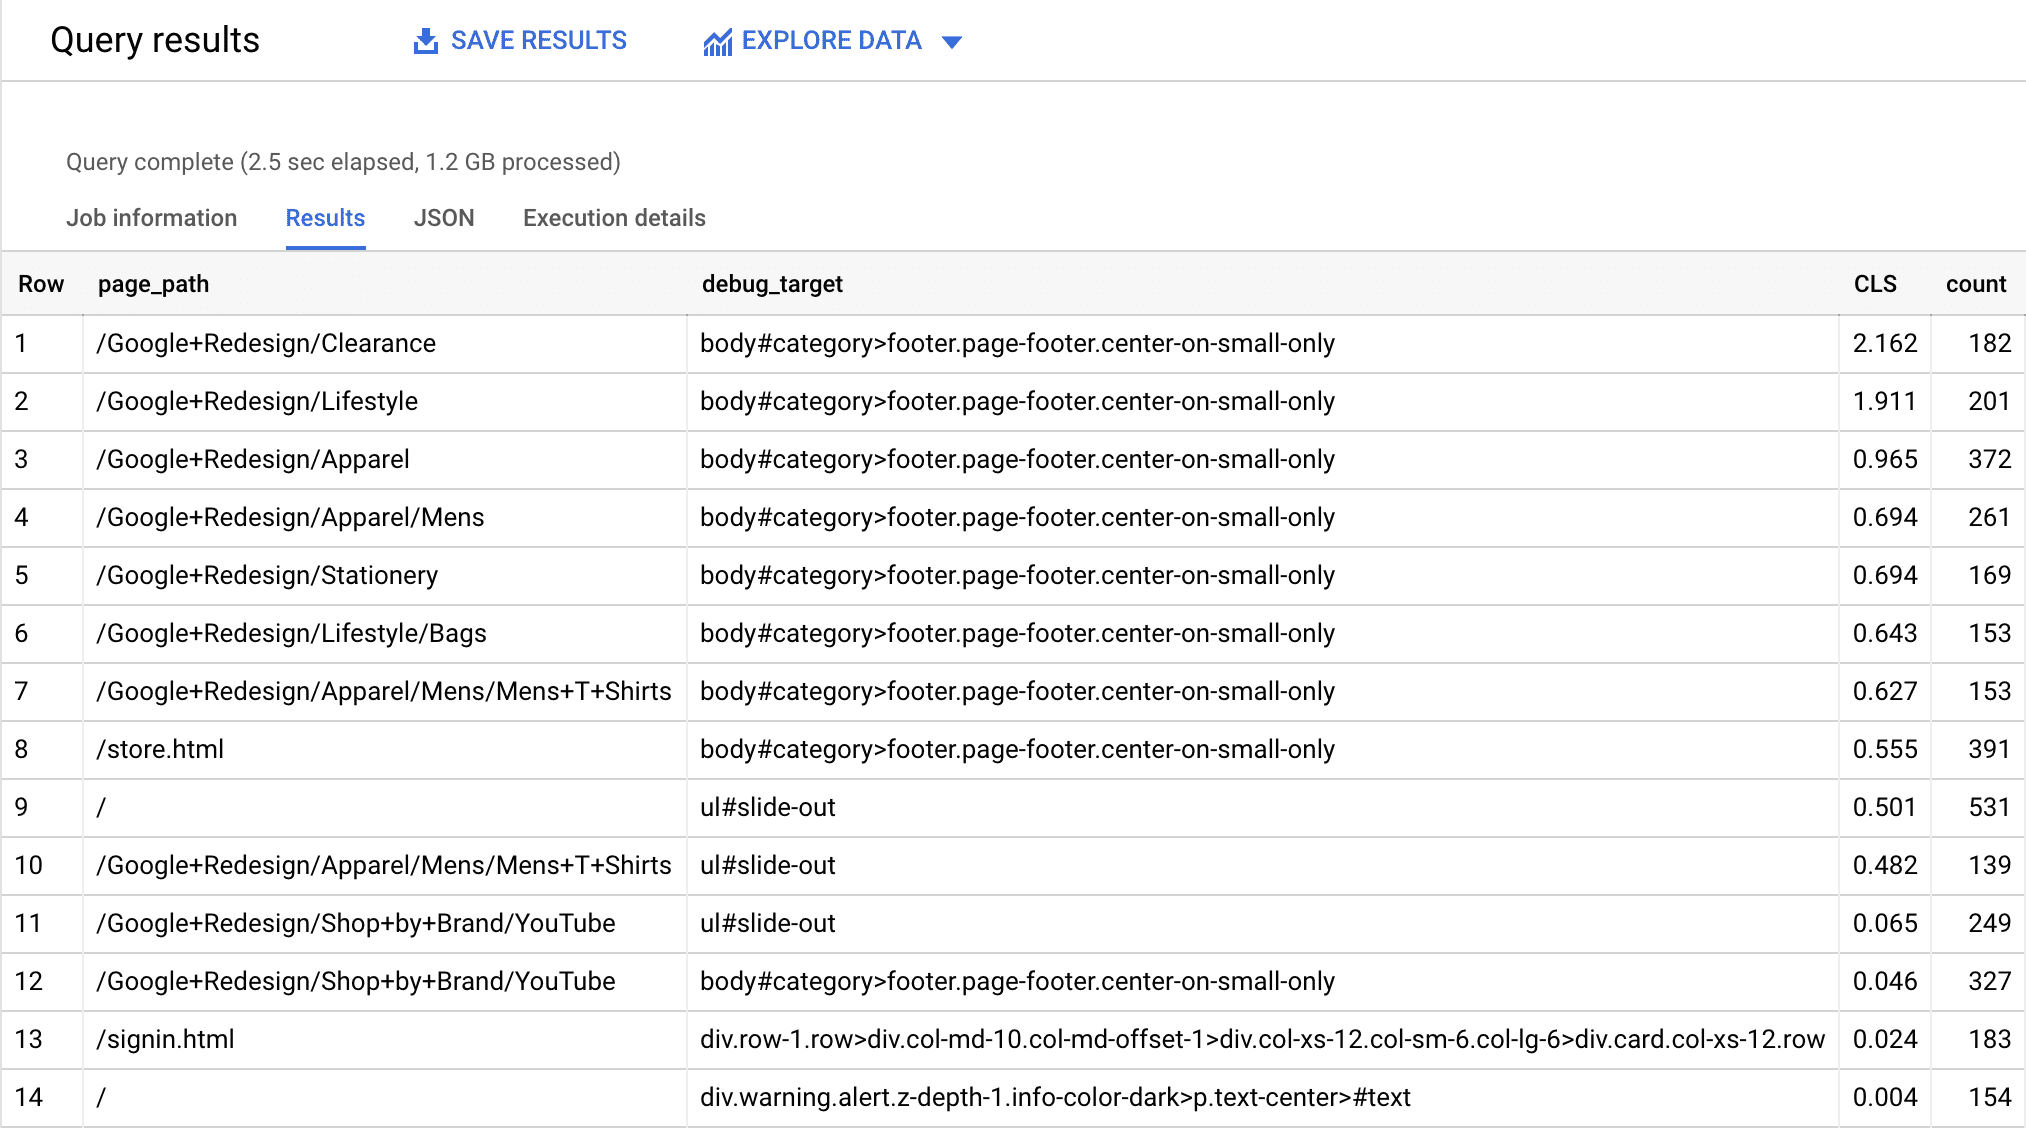
Knowing what elements on the page are shifting should make it much easier to identify and fix the root cause of the problem.
Keep in mind that the elements reported here might not be the same elements that you see shifting when you're debugging your pages locally, which is why it's so important to capture this data in the first place. It's very hard to fix things that you don't realize are problems!
Debug other metrics
The previous query shows the results for the CLS metric, but the exact same technique can be used to report on the debug targets for LCP and INP. Just replace the where clause with the relevant metric to debug:
WHERE metric_name = 'INP'
WHERE metric_name = 'LCP'
Again, you can refer to Debug performance in the field for instructions on how to collect and send debug information for each of the Core Web Vitals metrics.
Visualize
It can be challenging to get insights just by looking at the query results alone. For example, the following query lists daily 75th percentile values for LCP in the dataset.
# Subquery all Web Vitals events from the last 28 days
WITH web_vitals_events AS (
  SELECT event_name as metric_name, * EXCEPT(event_name, is_last_received_value) FROM (
    SELECT *, ROW_NUMBER() OVER (
      PARTITION BY (SELECT value.string_value FROM UNNEST(event_params) WHERE key = 'metric_id') ORDER BY (SELECT value.int_value FROM UNNEST(event_params) WHERE key = 'metric_start_time') DESC
    ) = 1 AS is_last_received_value
    FROM `bigquery_project_id.analytics_XXXXX.events_*`
    WHERE event_name in ('CLS', 'INP', 'LCP') AND
      _TABLE_SUFFIX BETWEEN FORMAT_DATE('%Y%m%d', DATE_SUB(CURRENT_DATE, INTERVAL 28 DAY)) AND FORMAT_DATE('%Y%m%d', DATE_SUB(CURRENT_DATE, INTERVAL 1 DAY))
  ) WHERE is_last_received_value
)
# Main query logic
SELECT
  event_date,
  metric_name,
  APPROX_QUANTILES(ROUND(metric_value, 2), 100)[OFFSET(75)] AS p75
FROM
  (
    SELECT
      event_date,
      metric_name,
      ROUND((SELECT COALESCE(value.double_value, value.int_value) FROM UNNEST(event_params) WHERE key = 'metric_value'), 3) AS metric_value
    FROM web_vitals_events
    WHERE
      metric_name = 'LCP'
  )
GROUP BY
  1, 2
ORDER BY event_date
From these query results, it's difficult to identify trends or outliers just by looking at the data.
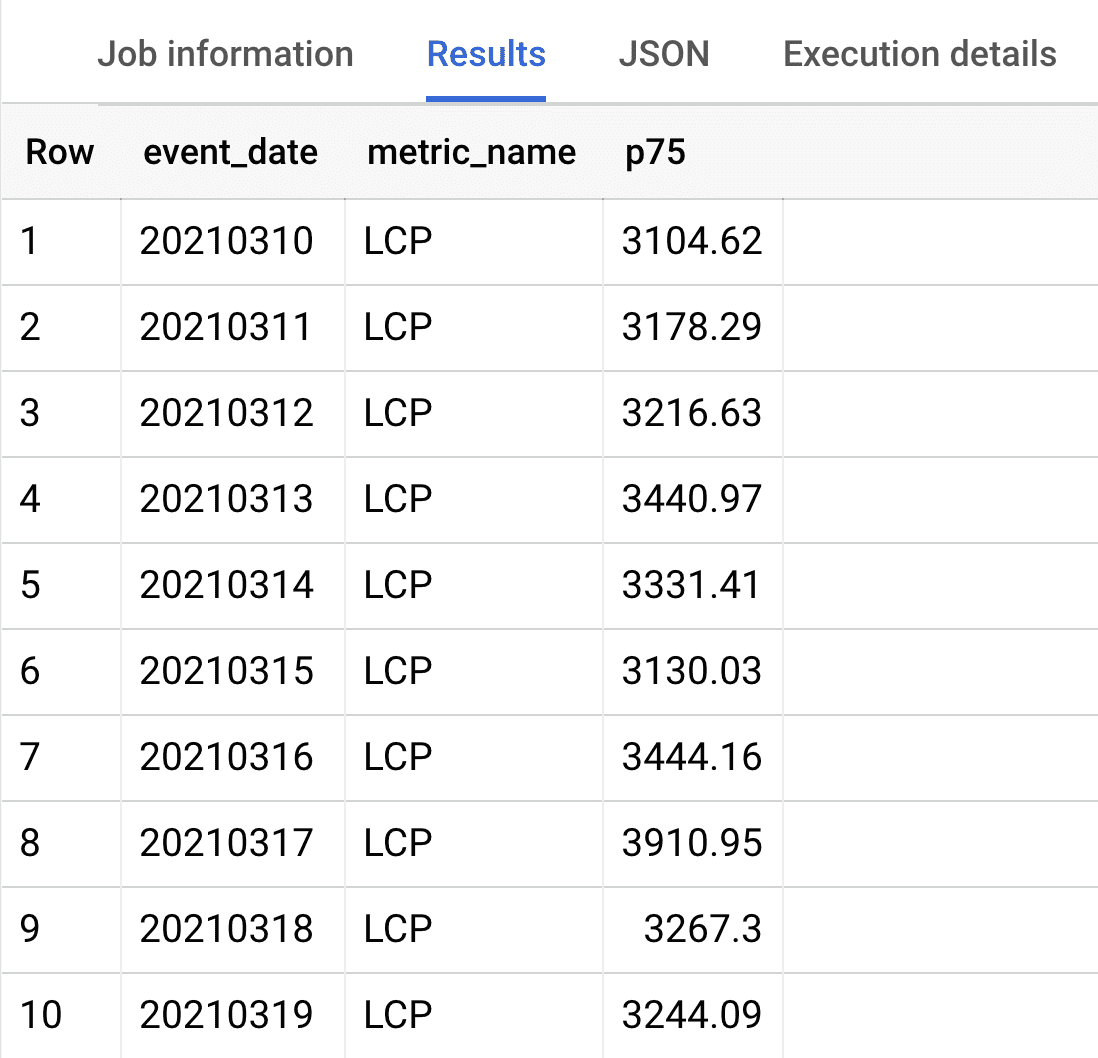
In such cases, visualizing the data can help you derive insights more quickly.
Visualize query results in Looker Studio
BigQuery provides a quick way to visualize any query results through Data Studio. Looker Studio is a data visualization and dashboarding tool that is free to use. To visualize your query results, after running your query in the BigQuery UI, click the Explore Data button and select Explore with Looker Studio.

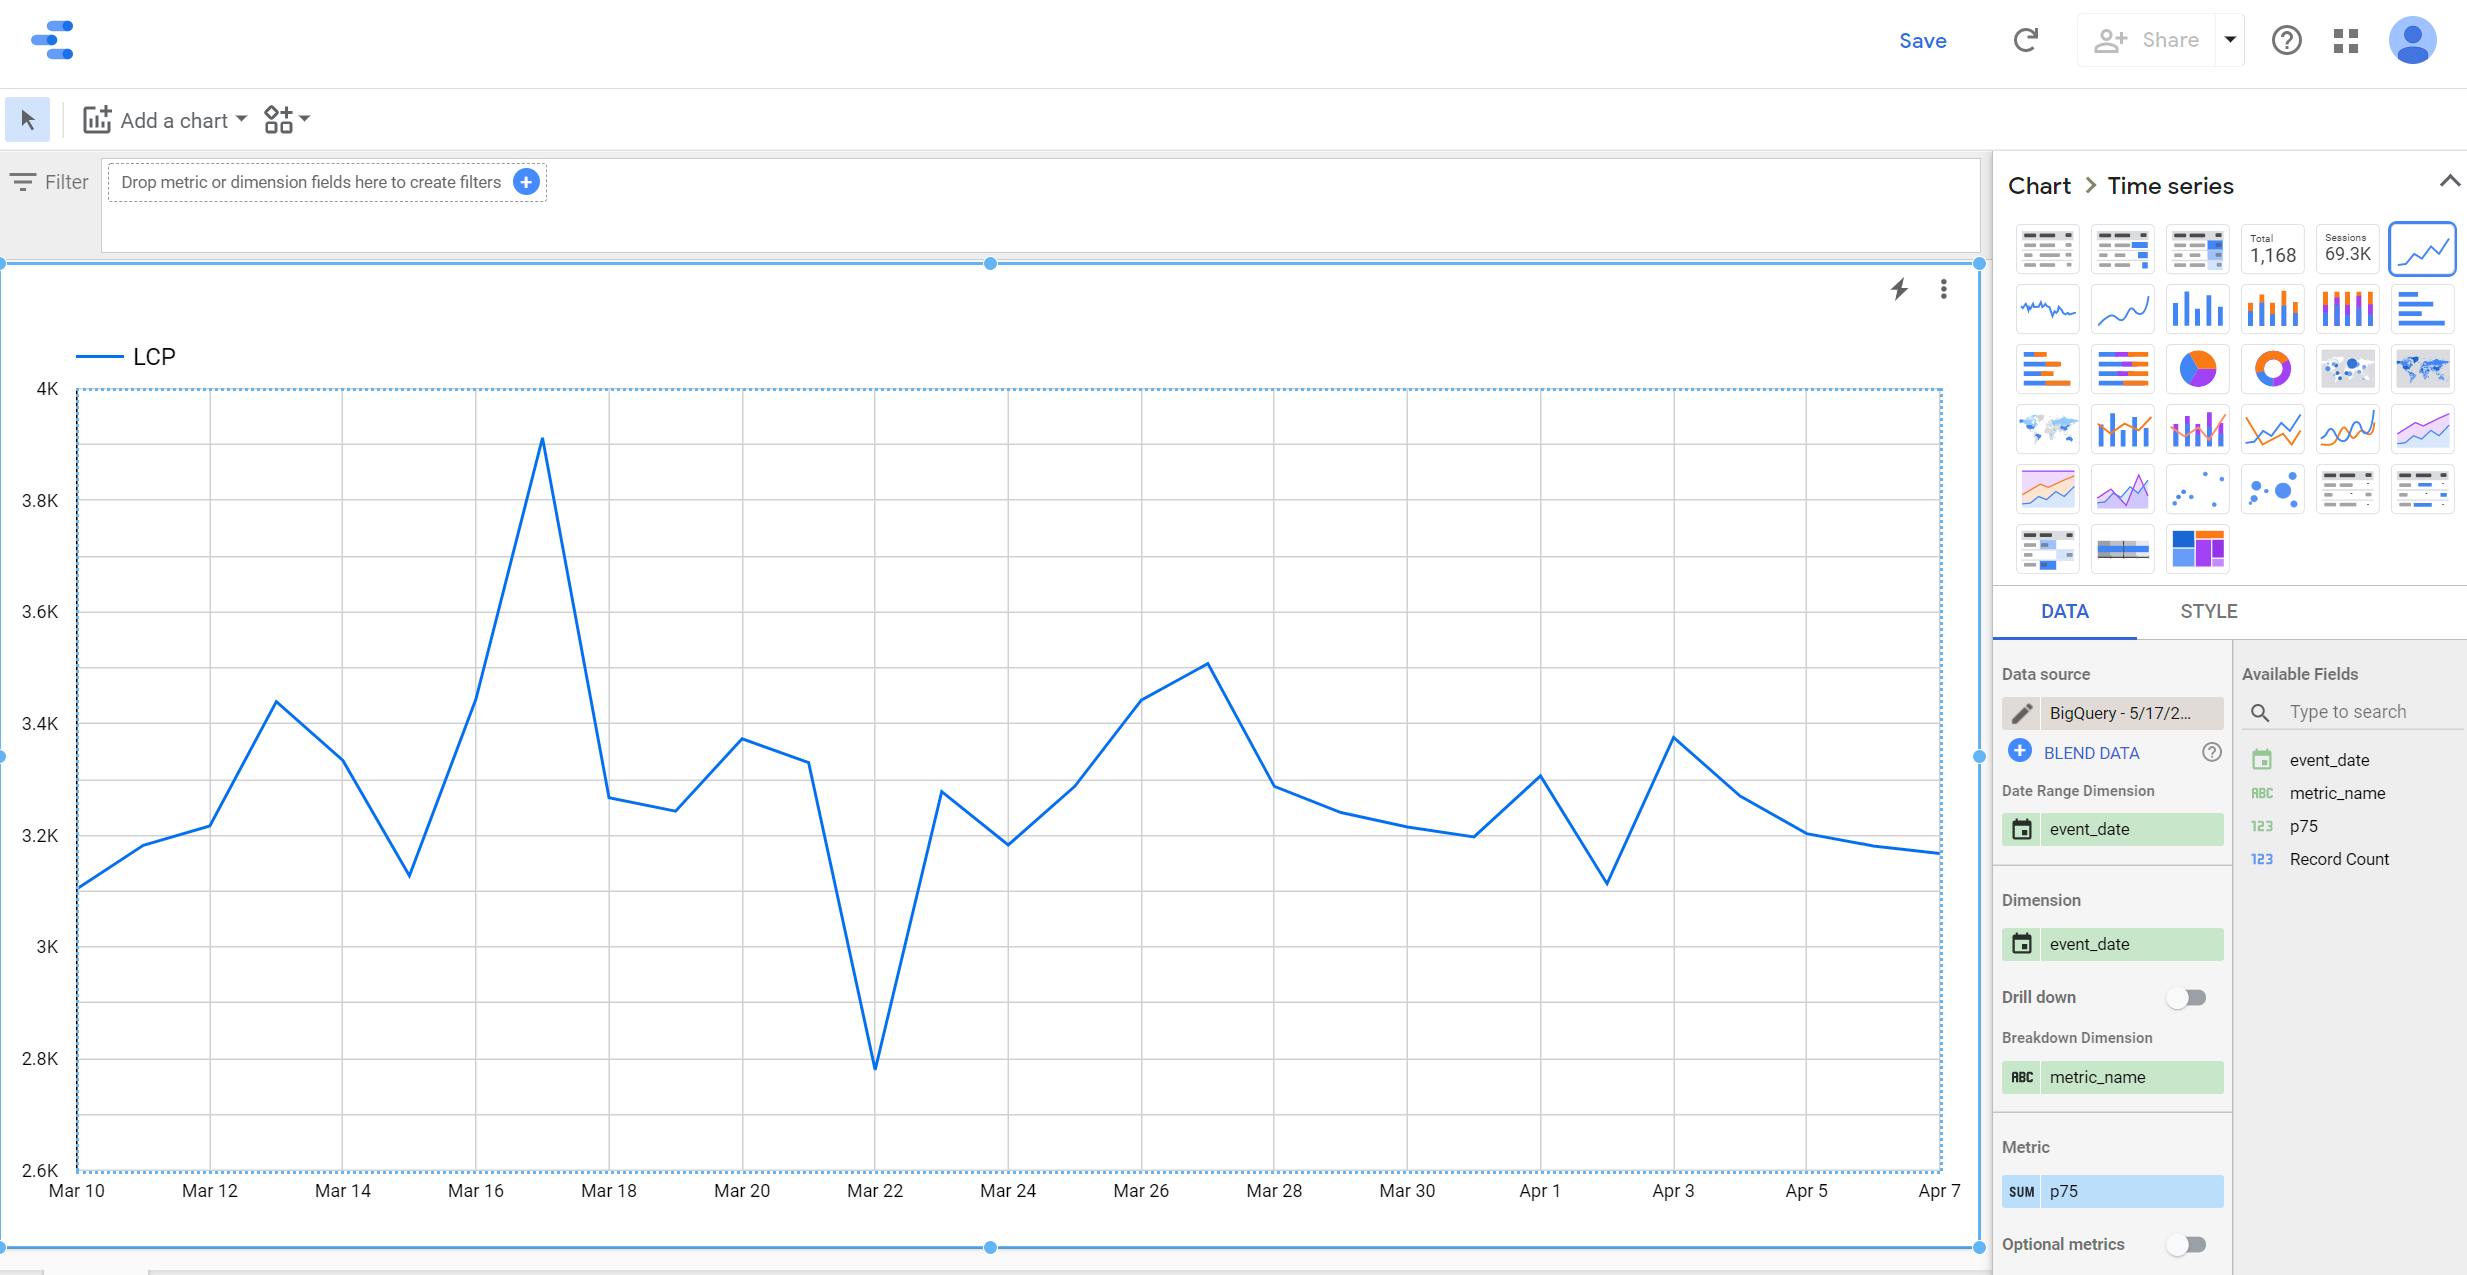
This will create a direct link from BigQuery into Looker Studio in the explore view. In this view, you can select the fields you want to visualize, choose chart types, setup filters, and create ad hoc charts for quick visual analysis. From the previous query results, you can create this line chart to see the trend of LCP values over time:
With this direct link between BigQuery and Looker Studio, you can create quick charts from any of your queries and do visual analysis. However, if you want to do additional analysis, you might want to look at several charts in an interactive dashboard to get a more holistic view or to be able to drill down into the data. Having a handy dashboard means you don't have to write queries and generate charts manually every time you want to analyze your metrics.
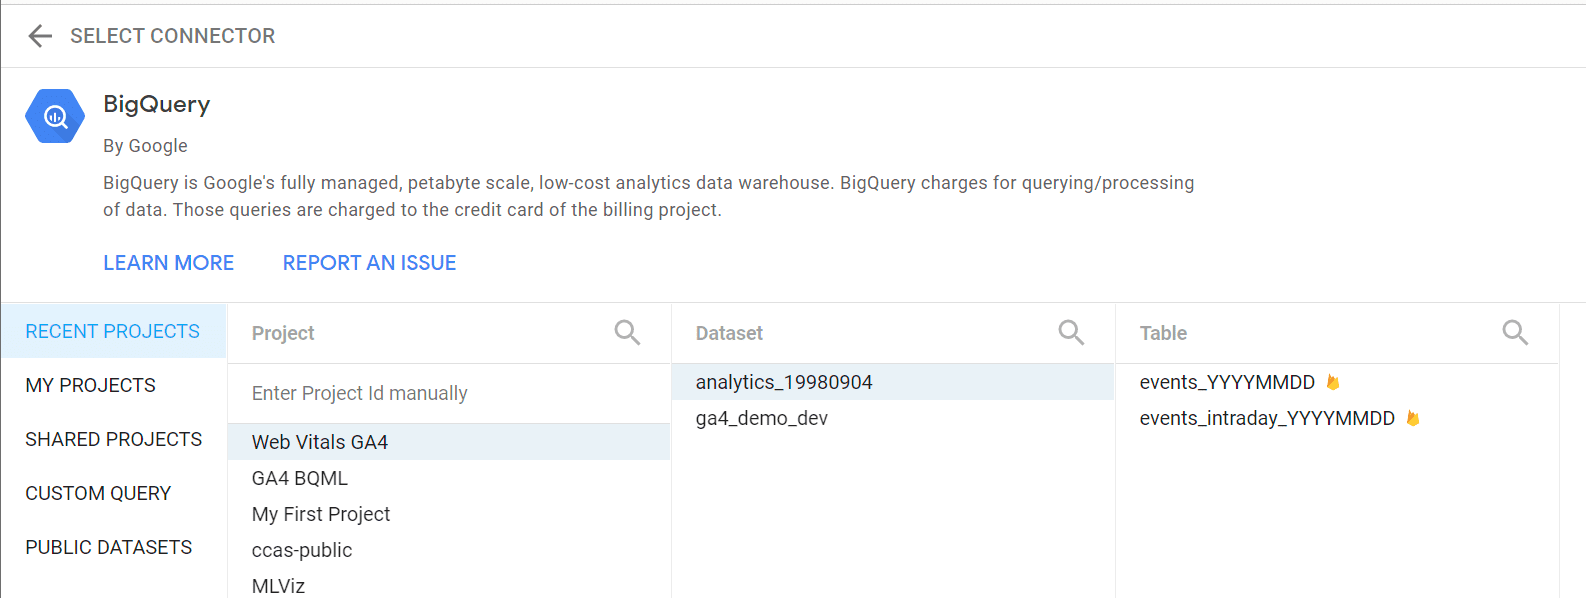
You can create a dashboard in Looker Studio using the native BigQuery connector. To do so, navigate to datastudio.google.com, create a new data source, select the BigQuery connector, and choose the dataset you want to work with:
Materialize Web Vitals data
When creating dashboards of the Web Vitals event data as described previously, it's not efficient to use the Google Analytics 4 export dataset directly. Due to the structure of the GA4 data and the preprocessing required for the Web Vitals metrics, parts of your query will end up running multiple times. This creates two problems: dashboard performance and BigQuery costs.
You can use the BigQuery sandbox mode at no charge. With BigQuery's free usage tier, the first 1 TB of query data processed per month is free. For the analysis methods discussed in this post, unless you are using a significantly large dataset or are heavily querying the dataset regularly, you should be able to stay within this free limit every month. But if you have a high traffic website and want to regularly monitor different metrics using a fast interactive dashboard, we suggest preprocessing and materializing your web vitals data while making use of BigQuery efficiency features like partitioning, clustering, and caching.
The following script will preprocess your BigQuery data (source table) and create a materialized table (target table). When using this query for your own dataset, you might also want to define a date range for the source table to lower the amount of data processed.
# Materialize Web Vitals metrics from GA4 event export data

# Replace target table name
CREATE OR REPLACE TABLE bigquery_project_id.ga4_demo_dev.web_vitals_summary
  PARTITION BY DATE(event_timestamp)
  CLUSTER BY metric_name
AS
SELECT
  ga_session_id,
  IF(
    EXISTS(SELECT 1 FROM UNNEST(events) AS e WHERE e.event_name = 'first_visit'),
    'New user',
    'Returning user') AS user_type,
  IF(
    (SELECT MAX(session_engaged) FROM UNNEST(events)) > 0, 'Engaged', 'Not engaged')
    AS session_engagement,
  evt.* EXCEPT (session_engaged, event_name),
  event_name AS metric_name,
  FORMAT_TIMESTAMP('%Y%m%d', event_timestamp) AS event_date
FROM
  (
    SELECT
      ga_session_id,
      ARRAY_AGG(custom_event) AS events
    FROM
      (
        SELECT
          ga_session_id,
          STRUCT(
            country,
            device_category,
            device_os,
            traffic_medium,
            traffic_name,
            traffic_source,
            page_path,
            debug_target,
            event_timestamp,
            event_name,
            metric_id,
            IF(event_name = 'LCP', metric_value / 1000, metric_value) AS metric_value,
            user_pseudo_id,
            session_engaged,
            session_revenue) AS custom_event
        FROM
          (
            SELECT
              (SELECT value.int_value FROM UNNEST(event_params) WHERE key = 'ga_session_id')
                AS ga_session_id,
              (SELECT value.string_value FROM UNNEST(event_params) WHERE key = 'metric_id')
                AS metric_id,
              ANY_VALUE(device.category) AS device_category,
              ANY_VALUE(device.operating_system) AS device_os,
              ANY_VALUE(traffic_source.medium) AS traffic_medium,
              ANY_VALUE(traffic_source.name) AS traffic_name,
              ANY_VALUE(traffic_source.source) AS traffic_source,
              ANY_VALUE(
                REGEXP_SUBSTR(
                  (SELECT value.string_value FROM UNNEST(event_params) WHERE key = 'page_location'),
                  r'^[^?]+')) AS page_path,
              ANY_VALUE(
                (SELECT value.string_value FROM UNNEST(event_params) WHERE key = 'debug_target'))
                AS debug_target,
              ANY_VALUE(user_pseudo_id) AS user_pseudo_id,
              ANY_VALUE(geo.country) AS country,
              ANY_VALUE(event_name) AS event_name,
              SUM(ecommerce.purchase_revenue) AS session_revenue,
              MAX(
                (
                  SELECT
                    COALESCE(
                      value.double_value, value.int_value, CAST(value.string_value AS NUMERIC))
                  FROM UNNEST(event_params)
                  WHERE key = 'session_engaged'
                )) AS session_engaged,
              TIMESTAMP_MICROS(MAX(event_timestamp)) AS event_timestamp,
              MAX(
                (
                  SELECT COALESCE(value.double_value, value.int_value)
                  FROM UNNEST(event_params)
                  WHERE key = 'metric_value'
                )) AS metric_value,
            FROM
              # Replace source table name
              `bigquery_project_id.analytics_XXXXX.events_*`
            WHERE
              event_name IN ('LCP', 'INP', 'CLS', 'first_visit', 'purchase')
            GROUP BY
              1, 2
          )
      )
    WHERE
      ga_session_id IS NOT NULL
    GROUP BY ga_session_id
  )
CROSS JOIN UNNEST(events) AS evt
WHERE evt.event_name NOT IN ('first_visit', 'purchase');
This materialized dataset has several advantages:
- The data structure is flattened and easier to query.
- It retains only the Web Vitals events from the original GA4 dataset.
- Session ID, user type (new versus returning), and session engagement information is directly available in columns.
- The table is partitioned by date and clustered by metric name. This usually reduces the amount of data processed for each query.
- Since you don't need to use wildcards to query this table, query results can get cached for upto 24 hours. This reduces costs from repeating the same query.
- If you use the BigQuery BI engine, you can run optimized SQL functions and operators on this table.
You can directly query this materialized table from within BigQuery UI or use it in Looker Studio using the BigQuery connector.
Use the Web Vitals Connector
Since making a dashboard from scratch is time consuming, we developed a packaged solution that will create a template dashboard for you. First make sure that you have materialized your Web Vitals table using the previous query. Then access the Web Vitals connector for Looker Studio using this link: goo.gle/web-vitals-connector
After providing a one time authorization, you should see the following configuration screen:
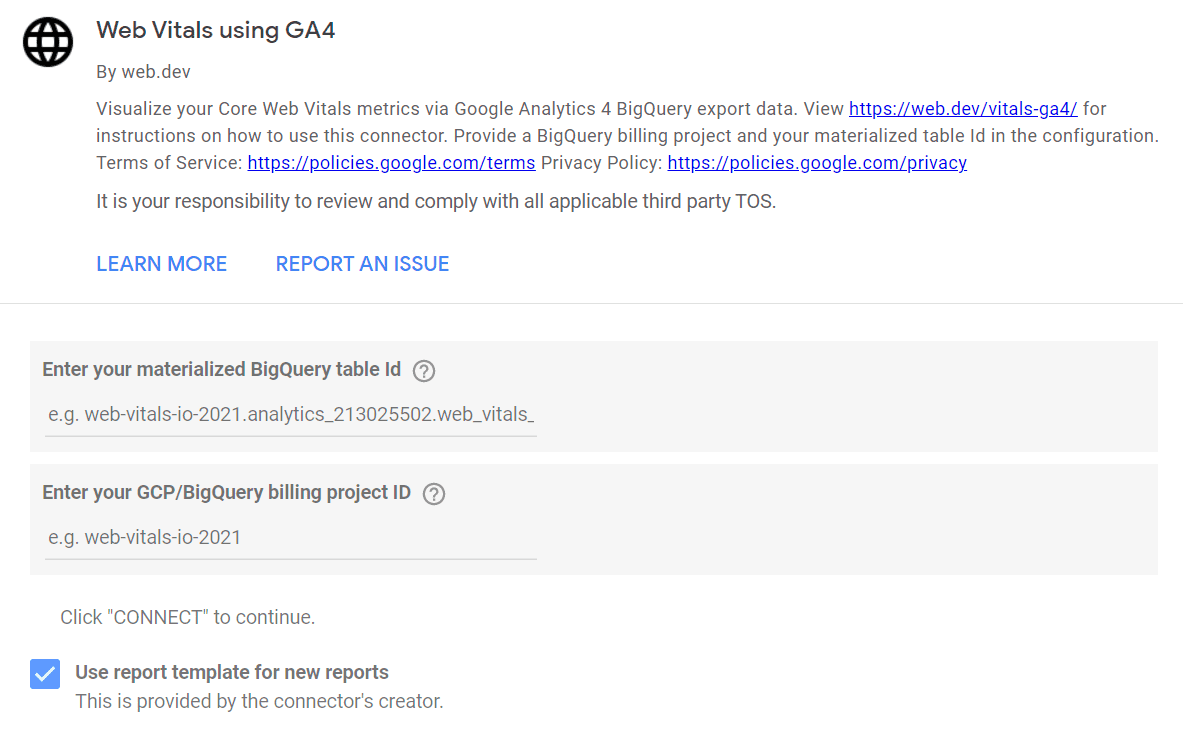
Provide the materialized BigQuery table ID (i.e. the target table) and your BigQuery billing project ID. After clicking connect, Looker Studio will create a new templated dashboard and associate your data with it. You can edit, modify, and share the dashboard as you like. If you create a dashboard once, you don't have to visit the connector link again, unless you want to create multiple dashboards from different datasets.
Navigate the dashboard
As you navigate the dashboard, you can see the daily trends of the Web Vitals metrics and some usage information for your website like users and sessions, in the Summary tab.
In the User Analysis tab, you can select a metric and then get a breakdown of the metrics percentile as well as user count by different usage and business metrics.
The Page Path Analysis tab will help you to identify problem areas on your website. Here, You can pick a metric to see the overview. But you also see the scatter-map of all the page paths with the percentile value on y axis and record count on x axis. The scatter map can help to identify pages which have lower than expected metric values. Once you select the pages using the scatter chart of the Page path table, you can further drill down the problem area by viewing the Debug Target table.
The Revenue Analysis tab is an example of how you can monitor your business and performance metrics in the same place. This section plots all sessions where the user made a purchase. You can compare the revenue earned versus user experience during a specific session .
Advanced usage
As you become more familiar with the dataset, you can edit the dashboard and add your own charts for richer and targeted analysis. To make the dashboard more useful, you can take the following steps:
- Setup scheduled query in BigQuery to get updated data. The materialization query we ran previously only takes a snapshot of your data at that moment. If you want to keep your dashboard updated with new data, you can run a scheduled query that will run every day and append your materialized table with the new data.
- Join first party data (e.g. CRM) for business insights. In the materialized
table, you can add
user_idas a separate column. This will let you join your first party data. If your first party data is not already in BigQuery, you can either load the data or use a federated data source. - Report your site or app version as a parameter in the data you send to Google Analytics and add it as a column in the materialized table. Then you can add that version data as a dimension in your charts to make it easier to see version changes affect performance.
- If you are expecting significantly heavy usage of the dataset through direct query or the dashboard, you can try using the paid version of BigQuery BI Engine.
Summary
This post covered the basics of how to use Google Analytics 4 and BigQuery to measure and debug performance with real-user data collected in the field. It also explained how to build automated reports and dashboards using Looker Studio and the Web Vitals Connector to make visualizing the data as easy as possible.
Some key takeaways from this post:
- Measuring performance with real user data is critical for understanding, debugging, and optimizing your site.
- You can get deeper insights when your performance metrics and your business metrics are in the same system. Google Analytics and BigQuery make this possible.
- BigQuery export of raw Google Analytics data gives you unlimited potential for in-depth, custom analysis using a query language you likely already know.
- Google has a number of APIs and visualization tools like Looker Studio that give you the freedom to build your reports exactly the way you want them to be built.


