Introduction
Today, the most important thing you can do for your site is make sure it performs well when visited from a phone or tablet. Read on and learn how to optimize your site for the mobile browser using Chrome DevTools and an Android device.
Why is Optimizing for the Mobile Web so Important?
Performance
Mobile devices are getting faster CPUs, more RAM, faster GPUs, and faster network access as we transition from 2G and 3G to 4G. Despite the drumbeat of progress, mobile devices are underpowered when compared to our computers. In more concrete terms, loading network resources takes longer, unpacking images takes longer, painting the page takes longer, executing scripts takes longer. It’s safe to assume that your page runs 5 to 10 times slower on a mobile device.
Battery
Mobile devices are exclusively battery powered. Users of mobile devices want that battery to last as long as possible. A sub-optimal site will drain a battery much quicker than needed. Minimize network traffic and reduce paints to reduce battery drain. When you fetch a resource, the WiFi or cell radio must be on, which drains battery. When the browser paints an element, the CPU and GPU usage spikes, which also drains battery.
Engagement
Performance is there to increase the metric that matters most to you. In Facebook we care about scrolling. In an A/B test, we slowed down scrolling from 60fps down to 30fps. Engagement collapsed. We said okay, therefore scrolling matters.
Facebook at Edge Conference
Mobile users expect to be able to get in and out quickly. The fastest site will get the most engagement.
Managing Performance
Chrome ships with a great set of developer tools. This article teaches you how to use these tools to profile your mobile site. If you’re already familiar with Chrome DevTools, great! If not, check these great tutorials:
Now that you’re caught up, let’s see how to accelerate your mobile site with DevTools. If this is the first time you’ve used Chrome DevTools for Android check out the getting started guide at the bottom of the article.
Using Chrome DevTools Remotely
With your Android device tethered to your computer. In desktop Chrome, navigate to http://localhost:9222 and on your Android device, open up your site. You will be taken to a list of open tabs on your Android device. Pick your page from the list of ‘Inspectable pages’.
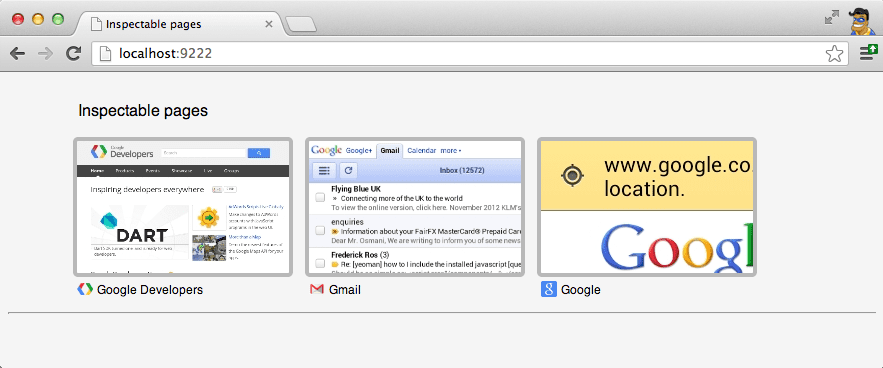
and you will be taken to Chrome DevTools for that page.

Aww… that familiar Chrome DevTools toolbar is right there. The most important thing to understand about remote Chrome DevTools is that they are the same DevTools you’re using today on your desktop. The only difference isthat your Android device is only responsible for the page, while your desktop is responsible for DevTools. Under the hood, the same data is collected and the same functionality is available.
As an example, I visited www.sfgate.com/movies on my phone. Using Chrome DevTools on my desktop I hovered over a div in the Elements tool and, just like it is on the desktop, the div is visually highlighted on my Android device.

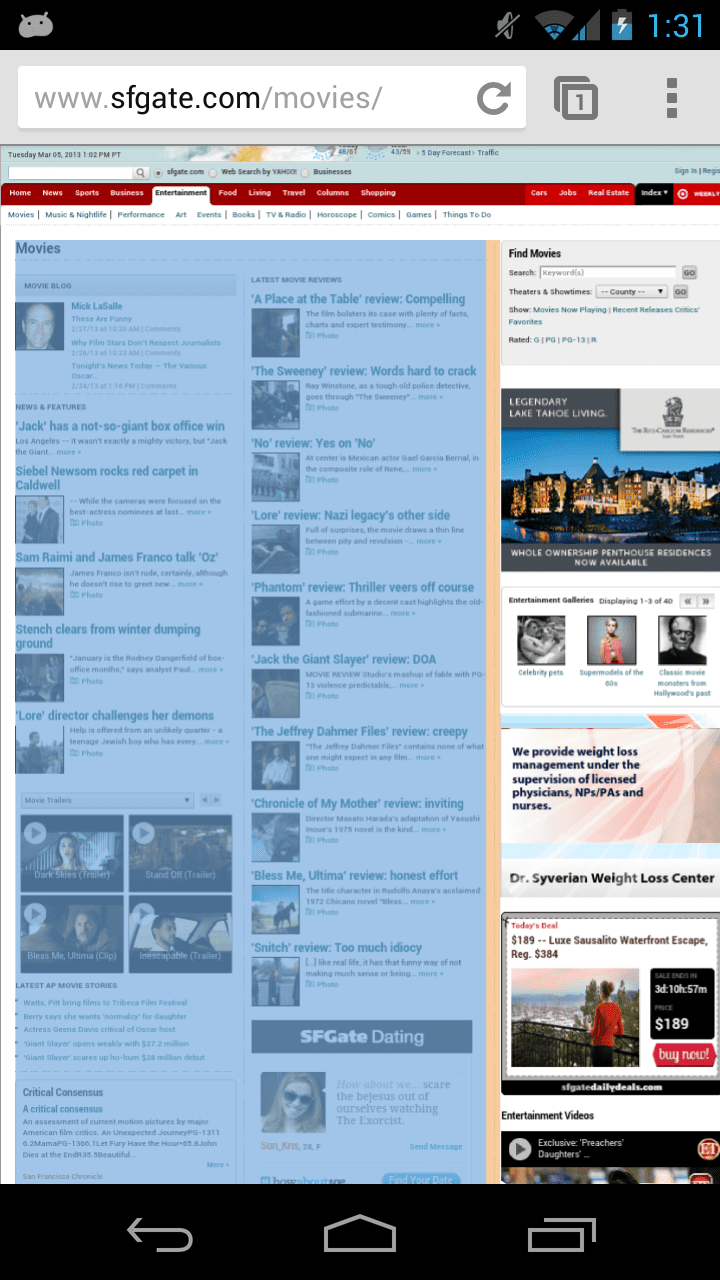
The Elements tool can also be used to toggle styles on and off, which will come in handy when we attempt to investigate paint times.
Shedding Light on Network Access
Network performance is import, and it’s even more important on the mobile web. Mobile devices are often on slower connections than our desktop and laptop computers. To make sure you’re doing the right thing, take a network snapshot by going to the Network tool and pressing record.

The screenshot shows the network traffic resulting from a Google search. Observe the network requests your site makes and find ways to minimize them. If your site makes polling requests to the server, you may want to pay attention to user activity and avoid polling when the user has been idle. The Network tool allows you to view the raw HTTP headers, useful in case mobile networks are altering them at all.
Optimizing Paint Times
One of the biggest bottlenecks in mobile web browsers is painting your page. Painting is the process of drawing an element on the page with the specified styling. When one element is expensive to paint it slows down painting of the whole page. Chrome makes an attempt at caching previously painted elements in an offscreen buffer. But, on mobile the amount of GPU RAM available is limited, limiting the number of elements that can be cached off screen. The side effect is more paints and each paint is slower than the desktop. In order to have responsive scrolling, you must minimize paint times.
Chrome 25 includes continuous page repaint mode. Continuous page repaint mode never caches painted elements and, instead, paints all elements each frame. By forcing all elements to be painted each frame, it is possible to perform A/B testing of paint times by toggling elements on and off, and styles on and off. While the process is manual, it’s an invaluable tool for tracking down how expensive painting each element on your page is. The first rule of optimization club is measure what you’re trying to optimize to get a baseline. Let’s work through a simple example.
First, enable continuous page repaint mode:
After enabling, a graph will be visible in the upper right corner of your Android device. The x-axis of the graph is time, divided into frames. The y-axis of the graph measures paint time, in milliseconds. You can see that, on my device, the page takes 14 milliseconds to paint. The minimum and maximum paint times are also shown along with GPU memory used.
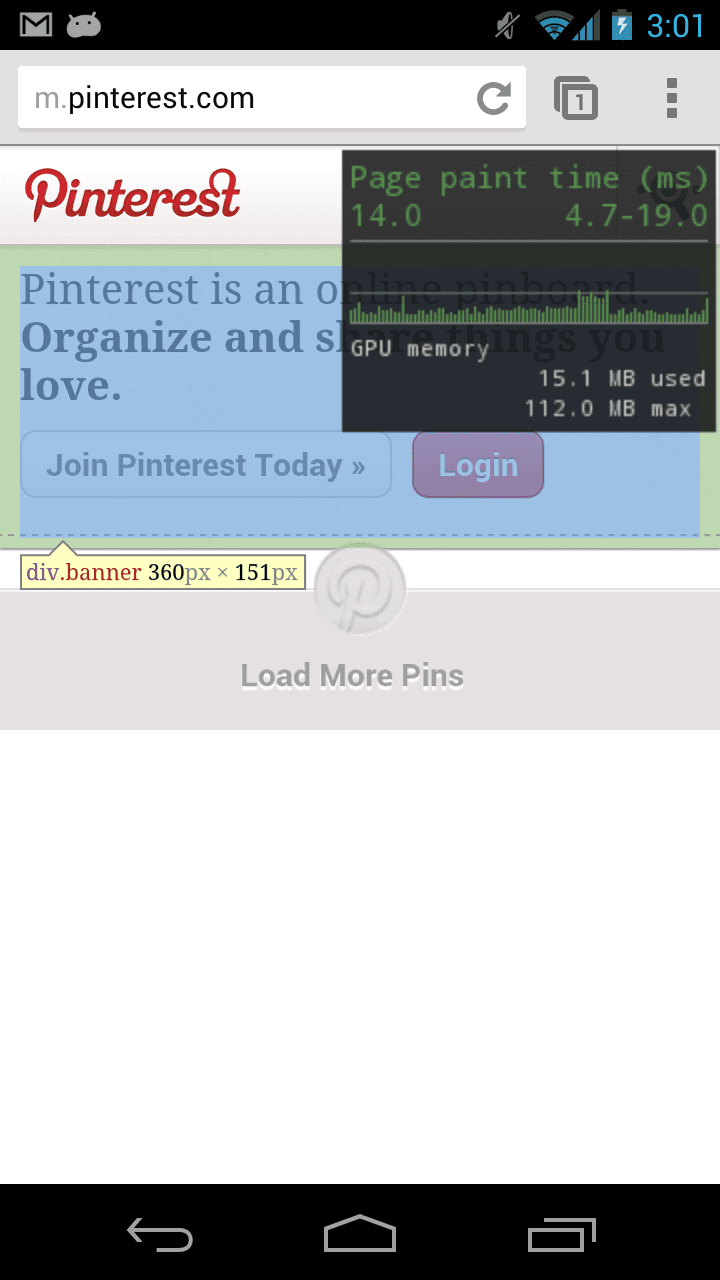
As an experiment, I set the style on the selected element to be display: none. Let’s see how expensive
the page is to paint now.
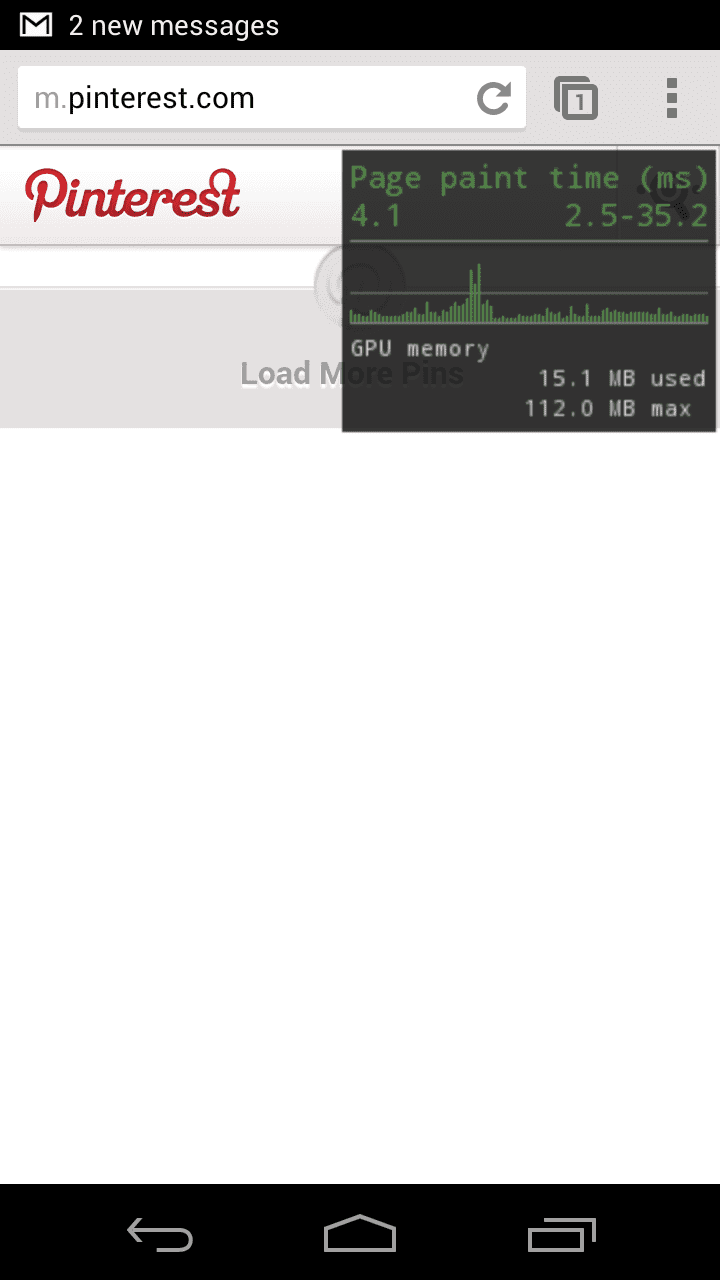
Paint times went from around 14 milliseconds per frame down to 4 milliseconds per frame. In other words, painting that one element took approximately 10 milliseconds. By following the process of toggling elements on and off and styles on and off you can quickly narrow in on the expensive parts of your page. Remember, faster paint times means less jank, a longer battery and more engagement from your users. When you’re ready to dig deeper, be sure to read this great article on continuous page repaint mode.
Advanced Features
about:tracing
Many of the more advanced developer features available in desktop Chrome are also available in Android Chrome too. For example, about:gpu-internals, about:appcache-internals, and about:net-internals are available. When investigating a particularly tricky problem you sometimes need more data in order to narrow in on the cause of your problem. On the desktop, you might be using about:tracing. If you’re not already familiar with about:tracing, watch my video on using and exploring the about:tracing profiling tool. It is possible to capture the same data from Android Chrome, follow these steps to get started:
- Download adb_trace.py
- Run adb_trace.py from the command line
- Use Chrome on Android
- Press enter on the command line, shutting down the adb_trace.py script.
After adb_trace.py completes you will have a JSON file that you can load in desktop Chrome’s about:tracing.
Starting Guide
Now that we've reviewed what remote Chrome DevTools can do, let's cover how to get started in your remote debugging session. If you haven’t used them before,read detailed instructions on how to get started. If you’ve already used them, but have forgotten exactly how to use them, I’ve listed shortened instructions here as well.
1. Install Android SDK
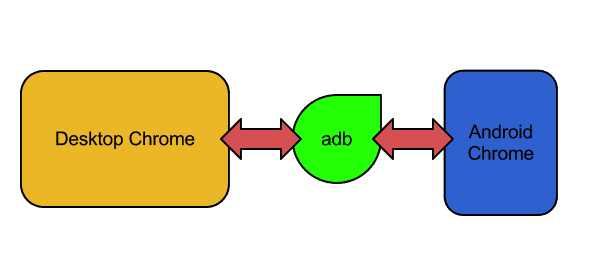
You might be wondering why you have to install the Android SDK when you are developing for the web. Included in the SDK is adb (Android Debug Bridge). Desktop Chrome needs to be able to communicate with your Android device. Chrome doesn’t talk directly with the Android device, instead it routes communication through adb.
2. Enable USB debugging on your device
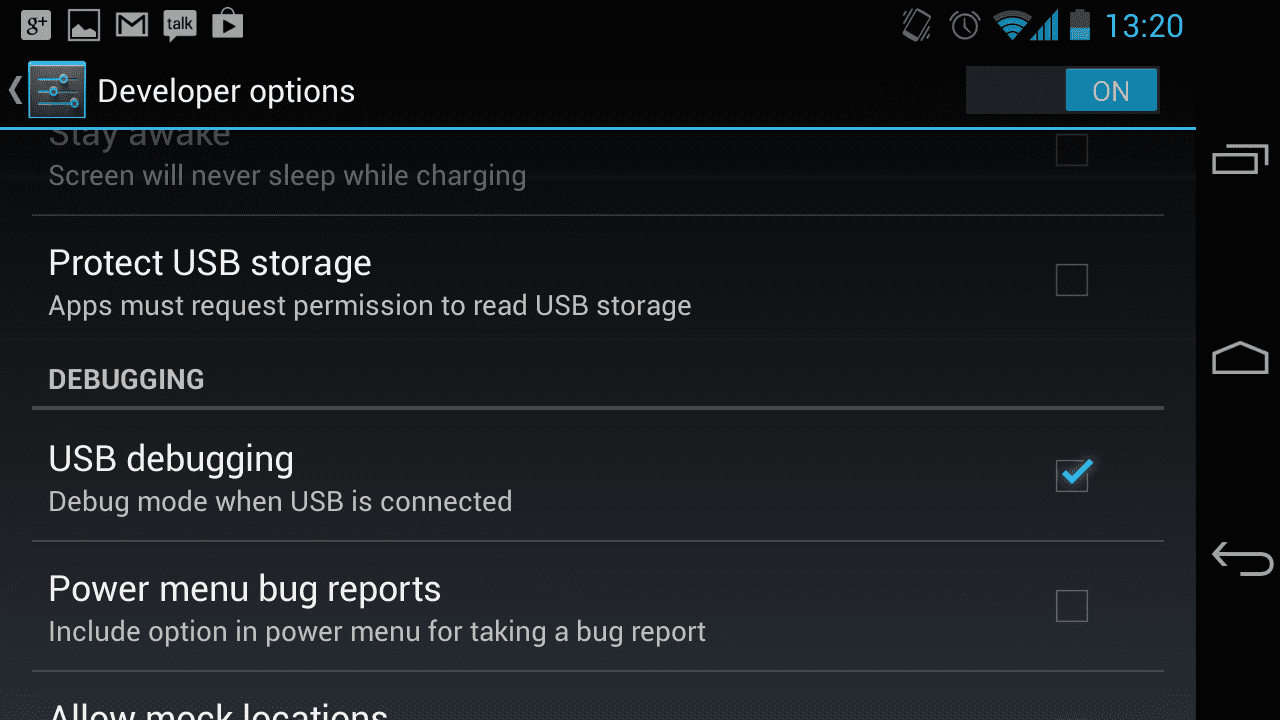
The option for enabling USB debugging can be found in Android Settings. Enable it.
3. Connect to the device
If you haven’t already, connect your Android device to your desktop via USB. If this is the first time you’ve used USB debugging you will be given the following prompt:
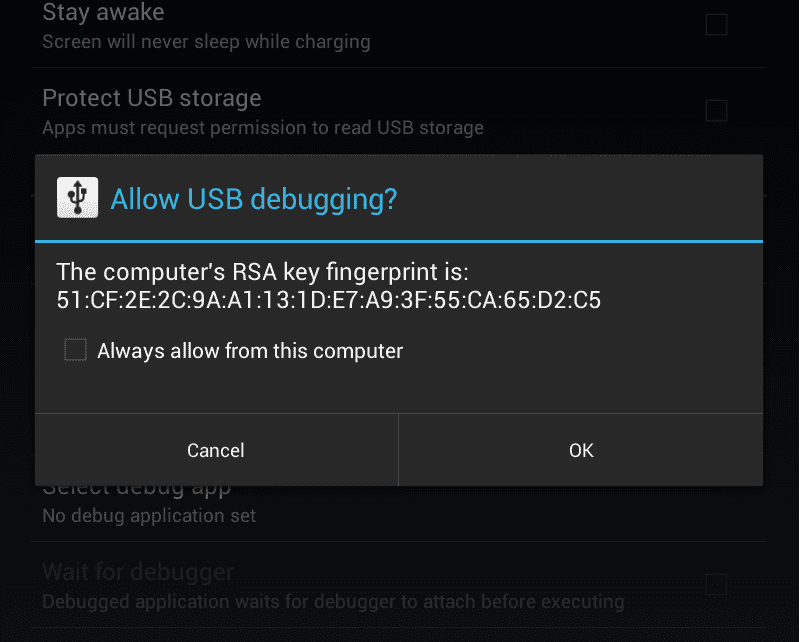
If you will be doing remote debug sessions frequently, I recommend checking ‘Always allow from this computer’.
4. Verify that your device is properly connected
Run adb devices from your command prompt. You should see your device listed.
5. Enable USB debugging in Chrome
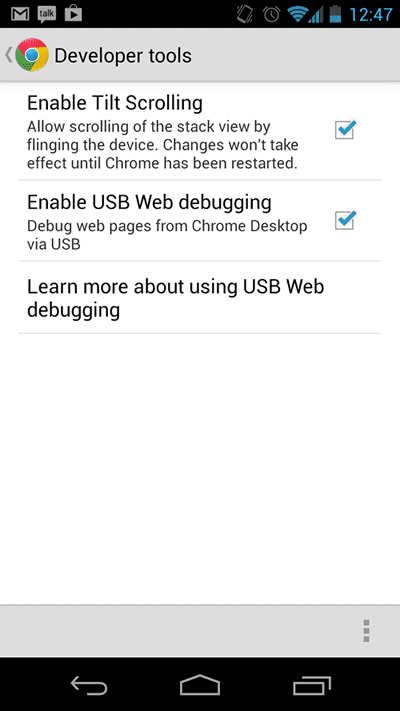
Open Settings > Advanced > DevTools and check the Enable USB Web debugging option as shown here:
6. Creating a DevTools connection to your Android device
Run the following command:
adb forward tcp:9222 localabstract:chrome_devtools_remote
creates a bridge between your desktop machine and your Android device via adb. If you run into any issues getting to this point, read over the detailed setup instructions here.
7. Verifying you're good to go
Verify that your device is properly connected by opening Chrome on your desktop and navigating to http://localhost:9222. If you get a 404, another error, or don’t see something like the following:

Read over the detailed setup instructions here.
Conclusion
Mobile users are often in a hurry and need to quickly get that important piece of information from your page. It is your duty as a mobile site builder to ensure that the page loads quickly and performs well on mobile. If not, user engagement will drop. Remote Chrome DevTools are functionally equivalent to their desktop counterparts. The UI is similar enough that you don’t need to learn a new set of tools. In other words, your work flow carries over. Remember, Facebook isn’t invincible to performance problems and your site isn’t either. Performant sites get more user engagement.

