The Web Vitals extension now shows you where your local experiences are in relation to real user experiences in the field.
Core Web Vitals are the most important metrics to measure to understand your users' experiences, because when users have good experiences, good things happen! The Web Vitals extension for Chrome is one tool in the Web Vitals toolbox that shows you performance data about the pages you visit as you browse the web.
Page performance depends on many factors, including hardware and network quality. How you experience a page on your machine may be very different from how the majority of users experience it. That's why version 1.0 of the Web Vitals extension includes a new feature that integrates real-user data from the Chrome UX Report (CrUX) with your local Core Web Vitals measurements. This feature displays your local measurements in the context of how other users have experienced the same pages. It comes with a sparkly new UI and I'm excited to show you how it works.
Field data from CrUX
CrUX is a public dataset of real-user experiences in Chrome. It powers some of the critical tools in the Core Web Vitals workflow like Search Console and PageSpeed Insights. The raw data for millions of websites is also publicly queryable in the CrUX dataset on BigQuery and the CrUX API. This Web Vitals extension update integrates the page and origin-level desktop data from the CrUX API.
User experience data is broken down into three qualitative ratings: good, needs improvement, and poor. The thresholds used for each rating are documented in the guides for each of the Core Web Vitals metrics: LCP, FID, and CLS. So for example, the CrUX API can tell you that 16% of real-user experiences on a given page are evaluated as having good LCP under 2.5 seconds.
New extension UI
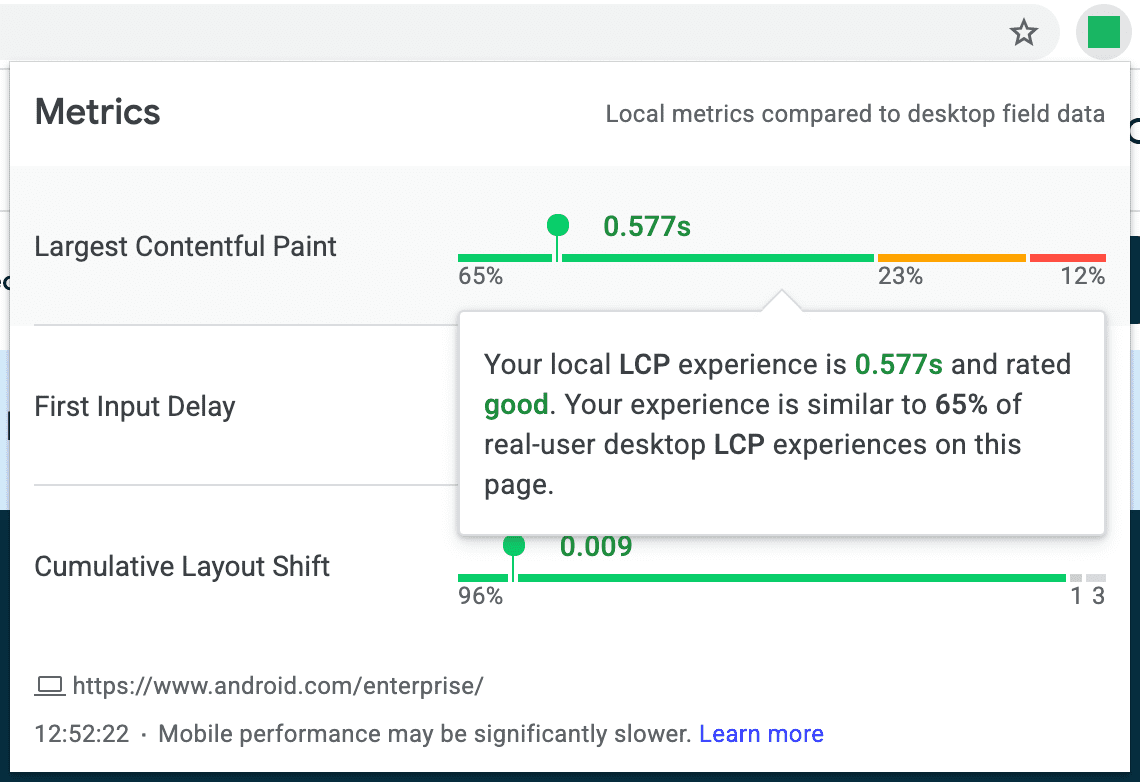
In the new Web Vitals extension interface, your local experience is layered on top of the broader distribution of real-user experiences. It's like when you're in an expansive place like a shopping mall and there's a big map with all of the stores and a pin labeled "YOU ARE HERE" to help you orient yourself and find where you're going.
The distributions of real-user data from CrUX are laid out on a horizontal bar for each metric. Your local experiences are displayed as single points on those horizontal bars. The position of your local experience on the horizontal bar indicates where that experience falls relative to the real-user distributions. This should make it immediately apparent when your local experience is very different from other users'. For example, if you have a slow LCP experience and only 1% of users have similar experiences, something unusual must have happened.
Falling back to origin-level data
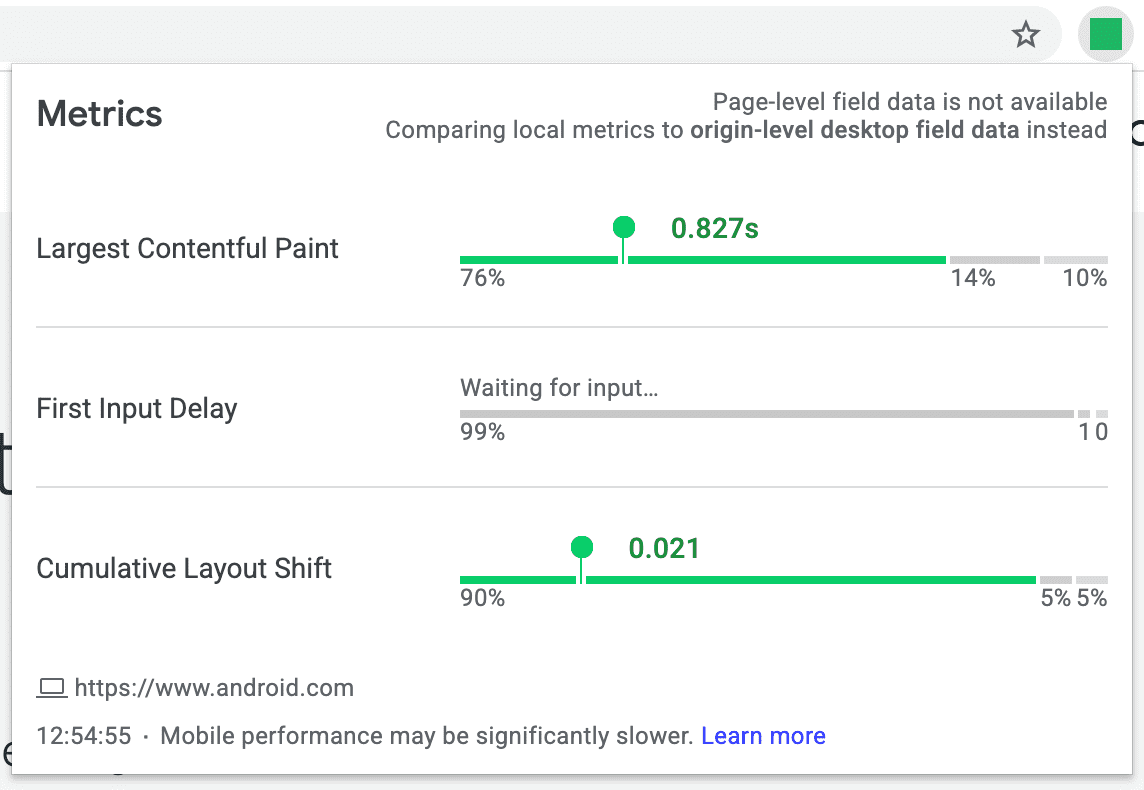
Some pages don't have URL-level data in the CrUX dataset. This can happen because the page is so new that it hasn't been picked up yet or because the page has insufficient traffic to be included in the dataset. In cases like these, Web Vitals extension falls back to more granular origin-level data whenever possible. This data represents the aggregate user experiences on all pages of the website, so while it may not be immediately relevant to your particular page experience, it should still offer some insight into how users experience the site as a whole.
Another common case is to see a "Waiting for input…" message. This is because FID is the only Core Web Vital that requires user interaction to be measured, so the extension won't have any local FID data to show until you interact with the page.
Edge cases
There are some less common edge cases that you may run into while using the extension.
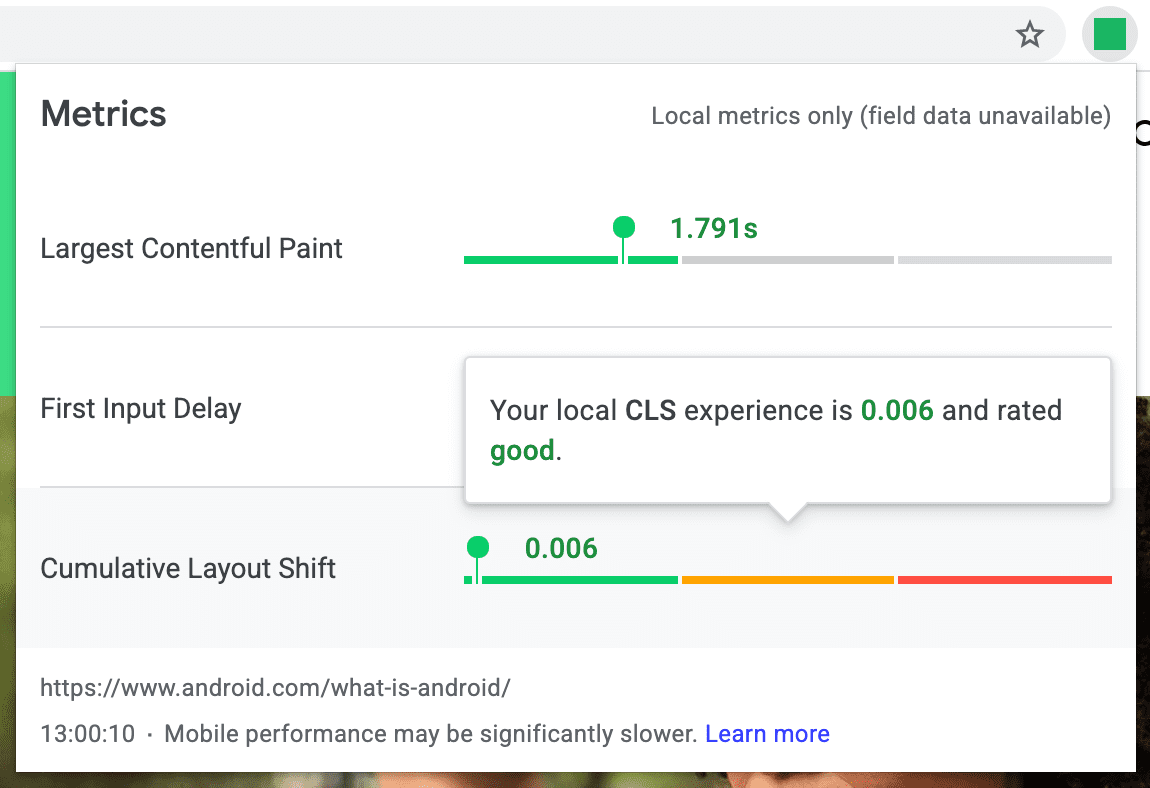
It can happen that entire origins have insufficient data. In that case, the extension will just show you how your local experiences performed.
How you interact with the page may also affect the relevance of the data. For example, loading the page in a background tab will count against the LCP metric the entire time until you foreground the page. If it takes you 90 seconds to switch to the tab, the LCP might appear as 91.5 seconds. When this happens, a little warning icon will appear next to your LCP value to warn you of the artificial inflation. Note that these kinds of irrelevant LCP values are ignored in the CrUX dataset.
One last edge case to be aware of is specific to FID. Because it depends on user interactions, that makes it less likely to be available in the dataset for pages and websites with fewer page views. So if you're visiting a page like that, you may only see field data for LCP and CLS. It's worth noting for the sake of completeness that the same could happen for LCP or CLS in extremely rare situations, but this issue is predominantly affected by FID.
Comparing field data from phones
By default, all of the data in the Web Vitals extension corresponds to real desktop users' experiences from the field. After all, this extension is only available on desktop versions of Chrome, so it'd be most relevant to see how users under similar conditions experience the page or origin.
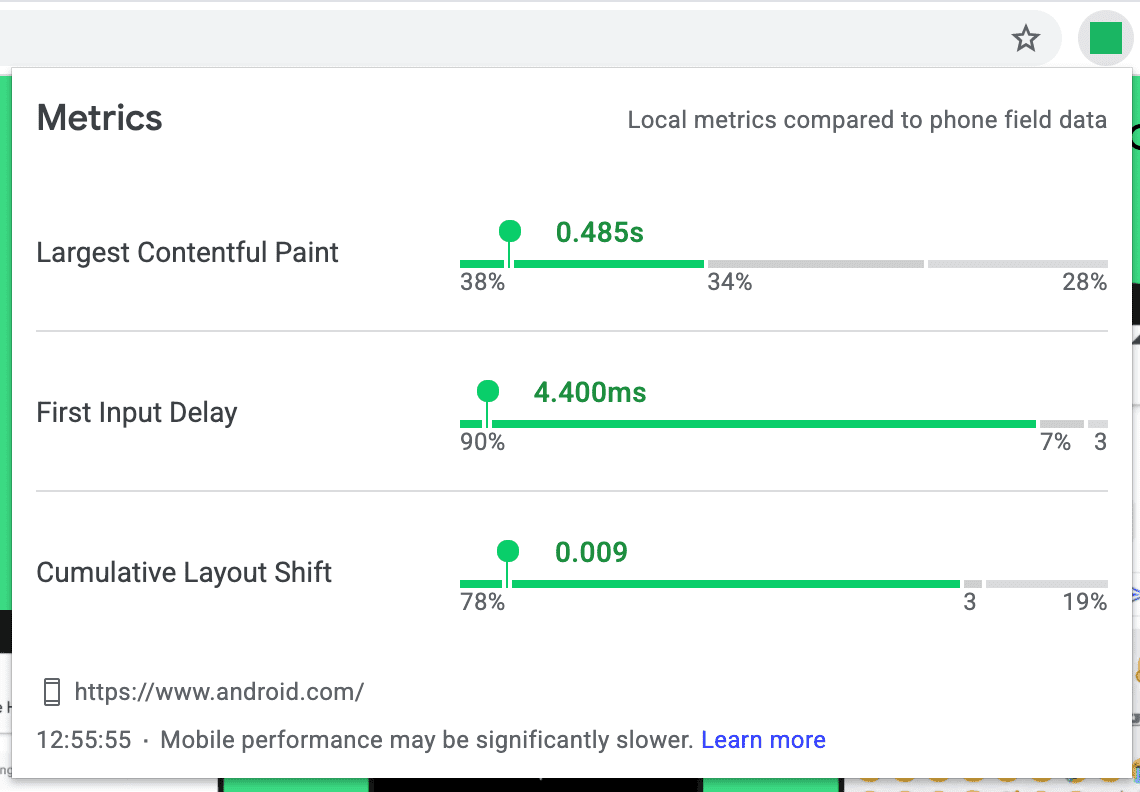
It's important to understand phone users' experiences too, so the extension has an advanced setting on the Options page that lets you see how your local experience compares to phone data from the field.
To enable phone data in the extension, follow these steps:
- Right click on the extension icon in the toolbar and select Options.
- Check the Compare local experiences to phone field data option.
The UI will update in a few places to indicate which mode you're in. Be aware that real phone users' experiences can be very different from that of desktop users, so use this feature with discretion.
Get the Web Vitals extension
To start using the latest version of the Web Vitals extension, head over to the Chrome Web Store to install it. Or if you're an existing user of the extension, you should be upgraded to version 1.0 automatically. If you have any feedback about your experience with the extension (feature requests, bug reports, anything), let us know in the open-source repository on GitHub. I hope it helps you better understand where your local experiences are in relation to other real users from the field!
Image credit: Mark Garlick/Science Photo Library/Getty Images