 Barry Pollard [X](https://twitter.com/tunetheweb) [GitHub](https://github.com/tunetheweb) [Mastodon](https://mastodon.social/@tunetheweb) [Bluesky](https://bsky.app/profile/tunetheweb.com) [Homepage](https://www.tunetheweb.com)  Jeremy Wagner [GitHub](https://github.com/malchata) [LinkedIn](https://www.linkedin.com/in/malchata) [Homepage](https://jlwagner.net/)
Published: October 26, 2021, Last updated: November 18, 2025
> [!NOTE]
> **Note:** Time to First Byte (TTFB) is a foundational metric for measuring connection setup time and web server responsiveness in both the lab and the field. It helps identify when a web server is too slow to respond to requests. In the case of navigation requests---that is, requests for an HTML document---it precedes every other meaningful loading performance metric.
## What is TTFB?
TTFB is a metric that measures the time between starting navigating to a page and when the first byte of a response begins to arrive.
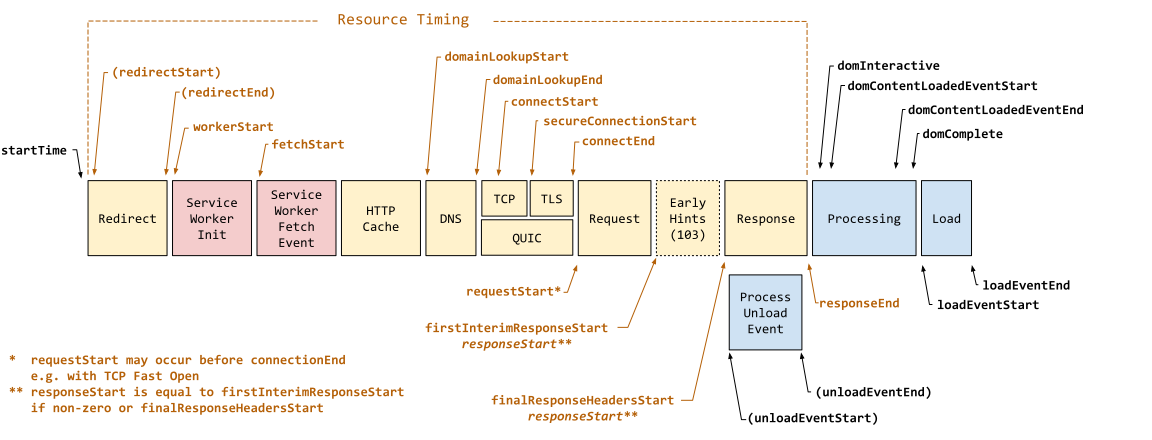 A diagram of network request phases and their associated timings. TTFB measures the elapsed time between `startTime` and `responseStart`.
TTFB is the sum of the following request phases:
- Redirect time
- Service worker startup time (if applicable)
- DNS lookup
- Connection and TLS negotiation
- Request, up until the point at which the first byte of the response has arrived
Reducing latency in connection setup time and on the backend can lower your TTFB.
### TTFB and Early Hints
The introduction of [103 Early Hints](https://developer.chrome.com/docs/web-platform/early-hints) causes some confusion as to what "first byte" TTFB measures. The 103 Early Hints counts as the "first bytes". The [`finalResponseHeadersStart`](https://developer.mozilla.org/docs/Web/API/PerformanceResourceTiming/finalResponseHeadersStart) is an additional timing entry to `responseStart` that measures the the start of the final document response (typically an HTTP 200 response) to be measured.
> [!NOTE]
> **Note:** Based on feedback from the community, Chrome updated the `responseStart` (and so the TTFB) to the start of the final document response (that was later standardized as `finalResponseHeadersStart`) from Chrome 115. However, this created a compatibility issue across many tools and so [was reverted in Chrome 133](https://chromestatus.com/feature/5158830722514944).
Early Hints is just a newer example of responding early. Some servers allow early flushing of the document response to happen before the main body is available---either with just the HTTP headers, or with the `` element, both of which could be considered similar in effect to Early Hints. This is another reason why all these are measured as `responseStart` and so TTFB.
There is real value in sending back data early if the full response is going to take some more time. However, this does make it difficult to compare TTFB across different platforms or technologies depending on what features they use, and how that impacts the TTFB measurement being used. What is most important is to understand what the measure the tool you are using measures and how that is affected by the platform being measured.
### What is a good TTFB score?
Because TTFB precedes [user-centric metrics](https://web.dev/articles/user-centric-performance-metrics) such as [First Contentful Paint (FCP)](https://web.dev/articles/fcp) and [Largest Contentful Paint (LCP)](https://web.dev/articles/lcp), it's recommended that your server responds to navigation requests quickly enough so that the **75th percentile** of users experience an [FCP within the "good" threshold](https://web.dev/articles/fcp#what_is_a_good_fcp_score). As a rough guide, most sites should strive to have a TTFB of **0.8 seconds** or less.
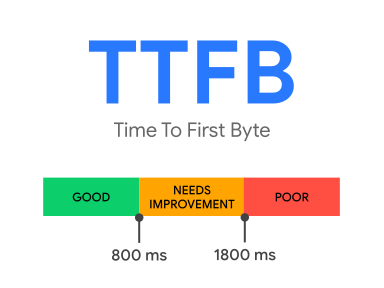 Good TTFB values are 0.8 seconds or less, and poor values are greater than 1.8 seconds.
> [!IMPORTANT]
>
> **Key point:** Because TTFB isn't a [Core Web Vitals](https://web.dev/articles/vitals) metric, it's not absolutely necessary that sites meet the "good" TTFB threshold, provided that it doesn't impede their ability to score well on the metrics that matter.
>
>
> Websites vary in how they deliver content. A low TTFB is crucial for getting markup out to the client as soon as possible. However, if a website delivers the initial markup quickly, but that markup then requires JavaScript to populate it with meaningful content---as is the the case with Single Page Applications (SPAs)---then achieving the lowest possible TTFB is especially important so that the client-rendering of markup can occur sooner.
>
>
> Conversely, a server-rendered site that does not require as much client-side work could have a higher TTFB, but better FCP and LCP values than an entirely client-rendered experience. This is why the TTFB thresholds are a "rough guide", and will need to be weighed against how your site delivers its core content.
## How to measure TTFB
TTFB can be measured in [the lab](https://web.dev/articles/user-centric-performance-metrics#in_the_lab) or in [the field](https://web.dev/articles/user-centric-performance-metrics#in_the_field) in the following ways.
### Field tools
- [Chrome User Experience Report](https://developer.chrome.com/docs/crux)
- [`web-vitals` JavaScript library](https://github.com/GoogleChrome/web-vitals)
### Lab tools
- In the [network panel](https://developer.chrome.com/docs/devtools/network) of Chrome's DevTools
- [WebPageTest](https://www.webpagetest.org/)
### Measure TTFB in JavaScript
You can measure the TTFB of [navigation requests](https://developer.mozilla.org/docs/Web/API/Request/mode) in the browser with the [Navigation Timing API](https://developer.mozilla.org/docs/Web/API/Navigation_timing_API). The following example shows how to create a [`PerformanceObserver`](https://developer.mozilla.org/docs/Web/API/PerformanceObserver) that listens for a `navigation` entry and logs it to the console:
new PerformanceObserver((entryList) => {
const [pageNav] = entryList.getEntriesByType('navigation');
console.log(`TTFB: ${pageNav.responseStart}`);
}).observe({
type: 'navigation',
buffered: true
});
The [`web-vitals` JavaScript library](https://github.com/GoogleChrome/web-vitals) can also measure TTFB in the browser more succinctly:
import {onTTFB} from 'web-vitals';
// Measure and log TTFB as soon as it's available.
onTTFB(console.log);
### Measure resource requests
TTFB can also be measured on *all* requests, not just navigation requests. In particular, resources hosted on cross-origin servers can introduce latency due to the need to set up connections to those servers.
> [!NOTE]
> **Note:** CrUX and other measurement tools may only provide TTFB data on the main navigation request.
To measure TTFB for resources in the field, use the [Resource Timing API](https://developer.mozilla.org/docs/Web/API/Resource_Timing_API/Using_the_Resource_Timing_API) within a `PerformanceObserver`:
new PerformanceObserver((entryList) => {
const entries = entryList.getEntries();
for (const entry of entries) {
// Some resources may have a responseStart value of 0, due
// to the resource being cached, or a cross-origin resource
// being served without a Timing-Allow-Origin header set.
if (entry.responseStart > 0) {
console.log(`TTFB: ${entry.responseStart}`, entry.name);
}
}
}).observe({
type: 'resource',
buffered: true
});
The previous code snippet is similar to the one used to measure the TTFB for a navigation request, except instead of querying for `'navigation'` entries, you query for `'resource'` entries instead. It also accounts for the fact that some resources loaded from the primary origin may return a value of `0`, since the connection is already open, or a resource is instantaneously retrieved from a cache.
> [!TIP]
> TTFB for cross-origin requests won't be accurately measurable in the field if cross-origin servers don't set a [`Timing-Allow-Origin` header](https://developer.mozilla.org/docs/Web/HTTP/Headers/Timing-Allow-Origin).
## How to improve TTFB
For guidance on improving your site's TTFB, see our in-depth guide to [optimizing TTFB](https://web.dev/articles/optimize-ttfb).