The research and methodology behind Core Web Vitals thresholds
 Bryan McQuade [X](https://twitter.com/bryanmcquade)  Barry Pollard [X](https://twitter.com/tunetheweb) [GitHub](https://github.com/tunetheweb) [Mastodon](https://mastodon.social/@tunetheweb) [Bluesky](https://bsky.app/profile/tunetheweb.com) [Homepage](https://www.tunetheweb.com)
Published: May 21, 2020, Last updated: May 7, 2025
[Core Web Vitals](https://web.dev/articles/vitals#core_web_vitals) are a set of field metrics that
measure important aspects of real-world user experience on the web. Core Web
Vitals includes metrics, as well as target thresholds for each metric, which
help developers qualitatively understand whether the experience of their site is
"good", "needs improvement", or is "poor". This post will explain the approach used to
choose thresholds for Core Web Vitals metrics generally, as well as how the
thresholds for each specific Core Web Vitals metric were chosen.
## Refresher: Core Web Vitals metrics and thresholds
The Core Web Vitals are three metrics: Largest Contentful Paint (LCP),
Interaction to Next Paint (INP), and Cumulative Layout Shift (CLS). Each metric measures
a different aspect of user experience: LCP measures perceived load speed and
marks the point in the page load timeline when the page's main content has
likely loaded; INP measures responsiveness and quantifies the experience users
feel when trying to interact with the page; and CLS measures visual
stability and quantifies the amount of unexpected layout shift of visible page
content.
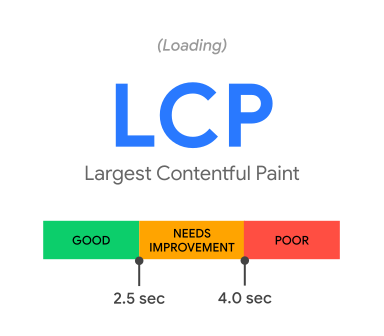
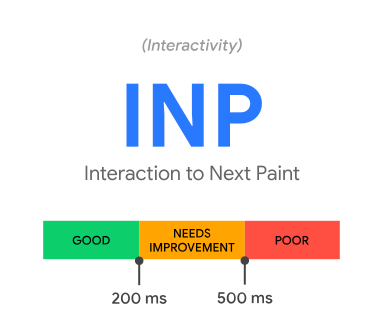
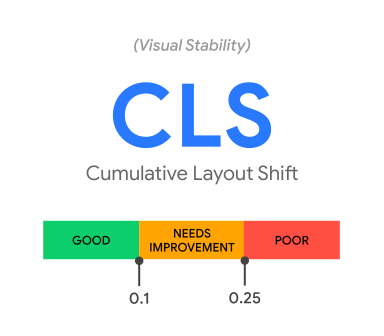
Each Core Web Vitals metric has associated thresholds, which categorize
performance as either "good", "needs improvement", or "poor":
| | Good | Poor | Percentile |
|---|---|---|---|
| Largest Contentful Paint | ≤2500 ms | \>4000 ms | 75 |
| Interaction to Next Paint | ≤200 ms | \>500 ms | 75 |
| Cumulative Layout Shift | ≤0.1 | \>0.25 | 75 |
Core Web Vitals thresholds
Additionally, to classify the overall performance of a page or site, we use the
75th percentile value of all page views to that page or site. In other words, if
at least 75 percent of page views to a site meet the "good" threshold, the site
is classified as having "good" performance for that metric. Conversely, if at
least 25 percent of page views meet the "poor" threshold, the site is classified
as having "poor" performance. So, for example, a 75th percentile LCP of 2
seconds is classified as "good", while a 75th percentile LCP of 5 seconds is
classified as "poor".
## Criteria for the Core Web Vitals metric thresholds
In this section, we'll look at the criteria for evaluating Core Web Vitals metric thresholds. The subsequent sections will go into more detail on how these criteria were applied to select the thresholds for each metric. In future years we anticipate making improvements and additions to the criteria and thresholds to further improve our ability to measure great user experiences on the web.
### High-quality user experience
Our primary goal is to optimize for the user and their quality of experience.
Given this, we aim to ensure that pages that meet the Core Web Vitals "good"
thresholds deliver a high quality user experience.
To identify a threshold associated with high-quality user experience, we look to
human perception and HCI research. While this research is sometimes summarized
using a single fixed threshold, we find that the underlying research is
typically expressed as a range of values. For example, research on the amount of
time users typically wait before losing focus is sometimes described as 1
second, while the underlying research is actually expressed as a range, from
hundreds of milliseconds to multiple seconds. The fact that perception
thresholds vary depending on user and context is further supported by aggregated
and anonymized Chrome metrics data, which shows that there is not a single
amount of time users wait for a web page to display content before aborting the
page load. Rather, this data shows a smooth and continuous distribution. For a
more in depth look at human perception thresholds and relevant HCI research, see
[The Science Behind Web
Vitals](https://blog.chromium.org/2020/05/the-science-behind-web-vitals.html).
In cases where relevant user experience research is available for a given metric
and there is reasonable consensus on the range of values in the literature, we
use this range as an input to guide our threshold selection process. In cases
where relevant user experience research is unavailable, such as for a new metric
like Cumulative Layout Shift, we instead evaluate real-world pages that meet
different candidate thresholds for a metric, to identify a threshold that
results in a good user experience.
### Achievable by existing web content
Additionally, to ensure that site owners can succeed in optimizing their sites
to meet the "good" thresholds, we require that these thresholds are achievable
for existing content on the web. For example, while zero milliseconds is an
ideal LCP "good" threshold, resulting in instant loading experiences, a zero
millisecond threshold is not practically achievable in most cases, due to
network and device processing latencies. Thus, zero milliseconds is not a
reasonable LCP "good" threshold for Core Web Vitals.
When evaluating candidate Core Web Vitals "good" thresholds, we verify that
those thresholds are achievable, based on data from the [Chrome User Experience
Report](https://developer.chrome.com/docs/crux)
(CrUX). To confirm that a threshold is achievable, we require that at least 10%
of [origins](https://web.dev/articles/same-site-same-origin#origin) meet the "good"
threshold. Additionally, to ensure that well-optimized sites are not
misclassified due to variability in field data, we also verify that
well-optimized content consistently meets the "good" threshold.
Conversely, we establish the "poor" threshold by identifying a level of
performance that only a minority of origins are not meeting. Unless
there is research available relevant to defining a "poor" threshold, by default
the worst-performing 10-30% of origins are classified as "poor".
### Whether to have the same or different criteria per device
Mobile and desktop usage typically have very different characteristics as to device capabilities and network reliability. This heavily impacts the "achievability" criteria and so suggests we should consider separate thresholds for each.
However, users' expectations of a good or poor experience is not dependent on device, even if the achievability criteria is. For this reason the Core Web Vitals recommended thresholds are not segregated by device and the same threshold is used for both. This also has the added benefit of making the thresholds simpler to understand.
Additionally, devices don't always fit nicely into one category. Should this be based on device form factor, processing power, or network conditions? Having the same thresholds has the side benefit of avoiding that complexity.
The more constrained nature of mobile devices means that most of the thresholds are therefore set based on mobile achievability. They more likely represent mobile thresholds---rather than a true joint threshold across all device types. However, given that [mobile is often the majority of traffic for most sites](https://almanac.httparchive.org/en/2022/mobile-web#traffic-from-mobile-versus-desktop), this is less of a concern.
### Final thoughts on criteria
When evaluating candidate thresholds, we found that the criteria were sometimes
in conflict with one another. For example, there can be a tension between a
threshold being consistently achievable and it ensuring consistently good user
experiences. Additionally, given that human perception research typically
provides a range of values, and user behavior metrics show gradual changes in
behavior, we found there is often no single "correct" threshold for a metric.
Thus, our approach for the Core Web Vitals has been to choose thresholds
that best meet the criteria, while recognizing that there is no one
perfect threshold and that we may sometimes need to choose from multiple
reasonable candidate thresholds. Rather than asking "what is the perfect
threshold?" we instead focused on asking "which candidate threshold best
achieves our criteria?"
These are also broad thresholds that we can apply across the whole of the web.
Many sites would benefit from optimizing even beyond the "good" thresholds and
and should seek to correlate with their individual business metrics.
## Choice of percentile
As noted earlier, to classify the overall performance of a page or site, we use
the 75th percentile value of all visits to that page or site. The 75th
percentile was chosen based on two criteria. First, the percentile should ensure
that a majority of visits to a page or site experienced the target level of
performance. Second, the value at the chosen percentile shouldn't be overly
impacted by outliers.
These goals are somewhat at odds with one another. To satisfy the first goal, a
higher percentile is typically a better choice. However, with higher
percentiles, the likelihood of the resulting value being impacted by outliers
also increases. If a few visits to a site happen to be on flaky network
connections which result in excessively large LCP samples, we don't want our
site classification to be decided by these outlier samples. For example, if we
were evaluating the performance of a site with 100 visits using a high
percentile such as the 95th, it would take just 5 outlier samples for the 95th
percentile value to be affected by the outliers.
Given these goals are a bit at odds, after analysis, we concluded that the 75th
percentile strikes a reasonable balance. By using the 75th percentile, we know
that most visits to the site (3 of 4) experienced the target level of
performance or better. Additionally, the 75th percentile value is less likely to
be affected by outliers. Returning to our example, for a site with 100 visits,
25 of those visits would need to report large outlier samples for the value at
the 75th percentile to be affected by outliers. While 25 of 100 samples being
outliers is possible, it is much less likely than for the 95th percentile case.
## Largest Contentful Paint
The LCP thresholds were set with the following quality of experience and achievability considerations.
### Quality of experience
1 second is often cited as the amount of time a user will wait before they begin
to lose focus on a task. On closer inspection of relevant research, we found
that 1 second is an approximation to describe a range of values, from roughly
several hundred milliseconds to several seconds.
Two commonly cited sources for the 1 second threshold are [Card and others](https://dl.acm.org/doi/10.1145/108844.108874) and
[Miller](https://dl.acm.org/doi/10.1145/1476589.1476628). Card defines a
1-second "immediate response" threshold, citing Newell's [Unified Theories of
Cognition](https://dl.acm.org/doi/book/10.5555/86564). Newell explains immediate
responses as "responses that must be made to some stimulus within *very
approximately one second* (that is, roughly from \~0.3sec to \~3sec)." This
follows Newell's discussion on "real-time constraints on cognition", where it is
noted that "interactions with the environment which evoke cognitive
considerations take place on the order of seconds" which range from roughly 0.5
to 2-3 seconds. Miller, another commonly cited source for the 1 second
threshold, notes "tasks which humans can and will perform with machine
communications will seriously change their character if response delays are
greater than two seconds, with some possible extension of another second or so."
Miller and Card's research describes the amount of time a user will wait before
losing focus as a range, from roughly 0.3 to 3 seconds, which suggests our LCP
"good" threshold should be in this range. Additionally, given that the existing
First Contentful Paint "good" threshold is 1 second, and that the Largest
Contentful Paint typically occurs after First Contentful Paint, we further
constrain our range of candidate LCP thresholds, from 1 second to 3 seconds. To
choose the threshold in this range that best meets our criteria, we look at the
achievability of these candidate thresholds next.
### Achievability
Using data from CrUX, we can determine the percentage of origins on the web that
meet our candidate LCP "good" thresholds.
| | 1 second | 1.5 seconds | 2 seconds | 2.5 seconds | 3 seconds |
|---|---|---|---|---|---|
| **phone** | 3.5% | 13% | 27% | 42% | 55% |
| **desktop** | 6.9% | 19% | 36% | 51% | 64% |
% of CrUX origins classified as "good" for candidate LCP thresholds as of April 2020
While less than 10% of origins meet the 1 second threshold, all other thresholds
from 1.5 to 3 seconds satisfy our requirement that at least 10% of origins meet
the "good" threshold, and are thus still valid candidates.
In addition, to ensure the chosen threshold is consistently achievable for
well-optimized sites, we analyze LCP performance for top-performing sites across
the web, to determine which thresholds are consistently achievable for these
sites. Specifically, we aim to identify a threshold that is consistently
achievable at the 75th percentile for top performing sites. We find that the 1.5
and 2 second thresholds are not consistently achievable, while 2.5 seconds is
consistently achievable.
To identify a "poor" threshold for LCP, we use CrUX data to identify a threshold
met by most origins:
| | 3 seconds | 3.5 seconds | 4 seconds | 4.5 seconds | 5 seconds |
|---|---|---|---|---|---|
| **phone** | 45% | 35% | 26% | 20% | 15% |
| **desktop** | 36% | 26% | 19% | 14% | 10% |
% of CrUX origins classified as "poor" for candidate LCP thresholds as of April 2020
For a 4 second threshold, roughly 26% of phone origins, and 21% of desktop
origins, would be classified as poor. This falls in our target range of 10-30%,
so we conclude that 4 seconds is an acceptable "poor" threshold.
Thus, we conclude that 2.5 seconds is a reasonable "good" threshold, and 4
seconds is a reasonable "poor" threshold for Largest Contentful Paint.
## Interaction to Next Paint
The INP thresholds were set with the following quality of experience and achievability considerations.
### Quality of experience
Research is reasonably consistent in concluding that delays in visual feedback
of up to around 100 ms are perceived as being caused by an associated source,
such as a user input. This suggests that an ideal Interaction to Next Paint "good"
threshold would be close to this.
Jakob Nielsen's commonly cited [Response Times: The 3 Important
Limits](https://www.nngroup.com/articles/response-times-3-important-limits/)
defines 0.1 second as the limit for having the user feel that the system is
reacting instantaneously. Nielsen cites Miller and Card, who cites Michotte's
1962 [The Perception of
Causality](https://psycnet.apa.org/record/1964-05029-000). In Michotte's
research, experiment participants are shown "two objects on a screen. Object A
sets off and moves towards B. It stops at the moment when it comes into contact
with B, while the latter then starts and moves away from A." Michotte varies the
time interval between when Object A stops and when Object B starts to move.
Michotte finds that, for delays up to roughly 100 ms, participants have the
impression that Object A causes the motion of Object B. For delays from roughly
100 ms to 200 ms, the perception of causality is mixed, and for delays over 200 ms,
the motion of Object B is no longer seen as having been caused by Object A.
Similarly, Miller defines a response threshold for "Response to control
activation" as "the indication of action given, ordinarily, by the movement of a
key, switch or other control member that signals it has been physically
actIvated. This response should be...perceived as a part of the mechanical
action induced by the operator. Time delay: No more than 0.1 second" and later
"the delay between depressing a key and visual feedback should be no more than
0.1 to 0.2 seconds".
More recently, in [Towards the Temporally Perfect Virtual
Button](https://dl.acm.org/doi/10.1145/2611387), Kaaresoja and others investigated
the perception of simultaneity between touching a virtual button on a
touchscreen and subsequent visual feedback indicating the button was touched,
for various delays. When the delay between button press and visual feedback was
85ms or less, participants reported the visual feedback appeared simultaneously
with the button press 75% of the time. Additionally, for delays of 100 ms or
less, participants reported a consistently high perceived quality of the button
press, with perceived quality falling off for delays of 100 ms to 150 ms, and
reaching very low levels for delays of 300 ms.
Given this, we conclude that research points to 100 ms as a "good" Interaction to Next Paint threshold for Web Vitals. Additionally, given users reported low quality levels for delays of 300 ms or more, ideally this would be the "poor" threshold.
### Achievability
Using data from CrUX, we determine that the majority of origins on the web meet
the 200 ms INP "good" threshold at the 75th percentile:
| | 100 ms | 200 ms | 300 ms | 400 ms | 500 ms |
|---|---|---|---|---|---|
| **phone** | 12% | 56% | 76% | 88% | 92% |
| **desktop** | 83% | 96% | 98% | 99% | 99% |
% of CrUX origins classified as "good" for candidate INP thresholds as of May 2022
We also spent extra attention looking at achievability of passing INP for lower-end mobile devices, where those formed a high proportion of visits to sites. This further confirmed the suitability of a 200 ms threshold.
Taking into consideration the 100 ms threshold supported by research into the quality of experience and the achievability criteria, we conclude that 200 ms is a reasonable threshold for good experiences
To identify a "poor" threshold for LCP, we use CrUX data to identify a threshold met by most origins:
| | 100 ms | 200 ms | 300 ms | 400 ms | 500 ms |
|---|---|---|---|---|---|
| **phone** | 88% | 44% | 24% | 12% | 8% |
| **desktop** | 17% | 4% | 2% | 1% | 1% |
% of CrUX origins classified as "poor" for candidate INP thresholds as of May 2022
This suggests we can have a "poor" threshold of 300 ms.
However, unlike LCP and CLS, INP has an inverse correlation with popularity---the more popular sites are often more complex, resulting in more likelihood of higher INP. When we look at the top 10,000 sites---which form the vast majority of internet browsing---we see a more complex picture emerge:
| | 100 ms | 200 ms | 300 ms | 400 ms | 500 ms |
|---|---|---|---|---|---|
| **phone** | 97% | 77% | 55% | 37% | 24% |
| **desktop** | 48% | 17% | 8% | 4% | 2% |
% of CrUX origins in top 10,000 classified as "poor" for candidate INP thresholds as of May 2022
On mobile, a 300 ms "poor" threshold would classify the majority of popular sites as "poor" stretching our achievability criteria, while 500 ms fits better in the range of 10-30% of sites. It should also be noted that the 200 ms "good" threshold is also tougher for these sites, but with 23% of sites still passing this on mobile this still passes our 10% minimum pass rate criteria.
For this reason we conclude a 200 ms is a reasonable "good" threshold for most sites, and greater than 500 ms is a reasonable "poor" threshold.
## Cumulative Layout Shift
The CLS thresholds were set with the following quality of experience and achievability considerations.
### Quality of experience
Cumulative Layout Shift (CLS) is a new metric that measures how much the visible
content of a page shifts around. Given CLS is new, we are not aware of research
that can directly inform the thresholds for this metric. Thus, to identify a
threshold that is aligned with user expectations, we evaluated real-world pages
with different amounts of layout shift, to determine the maximum amount of shift
that is perceived as acceptable before causing significant disruptions when
consuming page content. In our internal testing, we found that levels of shift
from 0.15 and higher were consistently perceived as disruptive, while shifts of
0.1 and lower were noticeable but not excessively disruptive. Thus, while zero
layout shift is ideal, we concluded that values up to 0.1 are candidate "good"
CLS thresholds.
### Achievability
Based on CrUX data, we can see that nearly 50% of origins have CLS of 0.05 or
lower.
| | 0.05 | 0.1 | 0.15 |
|---|---|---|---|
| **phone** | 49% | 60% | 69% |
| **desktop** | 42% | 59% | 69% |
% of CrUX origins classified as "good" for candidate CLS thresholds as of April 2020
While the CrUX data suggests that 0.05 might be a reasonable CLS "good"
threshold, we recognize that there are some use cases where it is
difficult to avoid disruptive layout shifts. For example, for third-party
embedded content, such as social media embeds, the height of the embedded
content is sometimes not known until it finishes loading, which can lead to a
layout shift greater than 0.05. Thus, we conclude that, while many origins meet
the 0.05 threshold, the slightly less stringent CLS threshold of 0.1 strikes a
better balance between quality of experience and achievability. It is our hope
that, going forward, the web ecosystem will identify solutions to address layout
shifts caused by third party embeds, which would allow for using a more
stringent CLS "good" threshold of 0.05 or 0 in a future iteration of Core Web
Vitals.
Additionally, to determine a "poor" threshold for CLS, we used CrUX data to
identify a threshold met by most origins:
| | 0.15 | 0.2 | 0.25 | 0.3 |
|---|---|---|---|---|
| **phone** | 31% | 25% | 20% | 18% |
| **desktop** | 31% | 23% | 18% | 16% |
% of CrUX origins classified as "poor" for candidate CLS thresholds as of April 2020
For a 0.25 threshold, roughly 20% of phone origins, and 18% of desktop origins,
would be classified as "poor". This falls in our target range of 10-30%, so we
concluded that 0.25 is an acceptable "poor" threshold.