Learn how to identify and fix layout shifts.
 Katie Hempenius [X](https://twitter.com/katiehempenius)  Barry Pollard [X](https://twitter.com/tunetheweb) [GitHub](https://github.com/tunetheweb) [Mastodon](https://mastodon.social/@tunetheweb) [Bluesky](https://bsky.app/profile/tunetheweb.com) [Homepage](https://www.tunetheweb.com)
Published: Mar 11, 2021, Last updated: Feb 7, 2025
The first part of this article discusses tooling for debugging layout shifts,
while the second part discusses the thought process to use when
identifying the cause of a layout shift.
## Tooling
You can debug Layout Shifts using the Layout Instability API, or with tooling like DevTools that summarizes data from this API in a more easily digestible format.
### Layout Instability API
The [Layout Instability API](https://wicg.github.io/layout-instability/) is the
browser mechanism for measuring and reporting layout shifts. All tools for
debugging layout shifts, including DevTools, are ultimately built upon the
Layout Instability API. However, using the Layout Instability API directly is a
powerful debugging tool due to its flexibility.
> [!NOTE]
> **Note:** The Layout Instability API is only [supported](https://caniuse.com/mdn-api_layoutshift) by Chromium browsers. At the current time there is no way to measure or debug layout shifts in non-Chromium browsers.
#### Usage
The same code [snippet](https://web.dev/articles/cls.md.txt#measure_cls_in_javascript) that
measures [Cumulative Layout Shift (CLS)](https://web.dev/articles/cls.md.txt) can also
serve to debug layout shifts. The following snippet logs information about layout
shifts to the console. Inspecting this log will provide you information
about when, where, and how a layout shift occurred.
```javascript
let cls = 0;
new PerformanceObserver((entryList) => {
for (const entry of entryList.getEntries()) {
if (!entry.hadRecentInput) {
cls += entry.value;
console.log('Current CLS value:', cls, entry);
}
}
}).observe({type: 'layout-shift', buffered: true});
```
When running this script be aware that:
- The `buffered: true` option indicates that the [`PerformanceObserver`](https://developer.mozilla.org/docs/Web/API/PerformanceObserver) should check the browser's [performance entry
buffer](https://www.w3.org/TR/performance-timeline-2/#dfn-performance-entry-buffer) for performance entries that were created before the observer's initialization. As a result, the `PerformanceObserver` will report layout shifts that happened both before and after it was initialized. Keep this in mind when inspecting the console logs. An initial glut of layout shifts can reflect a reporting backlog, rather than the sudden occurrence of numerous layout shifts.
- To avoid impacting performance, the `PerformanceObserver` waits until the main thread is idle to report on layout shifts. As a result, depending on how busy the main thread is, there may be a slight delay between when a layout shift occurs and when it is logged in the console.
- This script ignores layout shifts that occurred within 500 ms of user input and therefore don't count towards CLS.
Information about layout shifts is reported using a combination of two APIs: the
[`LayoutShift`](https://wicg.github.io/layout-instability/#layoutshift) and
[`LayoutShiftAttribution`](https://wicg.github.io/layout-instability/#sec-layout-shift-attribution)
interfaces. Each of these interfaces are explained in more detail in the
following sections.
#### LayoutShift
Each layout shift is reported using the `LayoutShift` interface. The contents of
an entry look like this:
```javascript
duration: 0
entryType: "layout-shift"
hadRecentInput: false
lastInputTime: 0
name: ""
sources: (3) [LayoutShiftAttribution, LayoutShiftAttribution, LayoutShiftAttribution]
startTime: 11317.934999999125
value: 0.17508567530168798
```
The previous entry indicates a layout shift during which three DOM elements changed
position. The layout shift score of this particular layout shift was `0.175`.
These are the properties of a `LayoutShift` instance that are most relevant to
debugging layout shifts:
| Property | Description |
|---|---|
| `sources` | The `sources` property lists the DOM elements that moved during the layout shift. This array can contain up to five sources. In the event that there are more than five elements impacted by the layout shift, the five largest (as measured by impact on layout stability) sources of layout shift are reported. This information is reported using the LayoutShiftAttribution interface (explained in more detail below). |
| `value` | The `value` property reports the [layout shift score](https://web.dev/articles/cls.md.txt#layout_shift_score) for a particular layout shift. |
| `hadRecentInput` | The `hadRecentInput` property indicates whether a layout shift occurred within 500 milliseconds of user input. |
| `startTime` | The `startTime` property indicates when a layout shift occurred. `startTime` is indicated in milliseconds and is measured relative to the [time that the page load was initiated](https://www.w3.org/TR/hr-time-2/#sec-time-origin). |
| `duration` | The `duration` property will always be set to `0`. This property is inherited from the [`PerformanceEntry`](https://developer.mozilla.org/docs/Web/API/PerformanceEntry) interface (the `LayoutShift` interface extends the `PerformanceEntry` interface). However, the concept of duration does not apply to layout shift events, so it is set to `0`. For information on the `PerformanceEntry` interface, refer to the [spec](https://w3c.github.io/performance-timeline/#the-performanceentry-interface). |
#### LayoutShiftAttribution
The `LayoutShiftAttribution` interface describes a single shift of a single DOM
element. If multiple elements shift during a layout shift, the `sources`
property contains multiple entries.
For example, the following JSON corresponds to a layout shift with one source: the
downward shift of the `` DOM element from `y: 76` to
`y:246`.
```json
// ...
"sources": [
{
"node": "div#banner",
"previousRect": {
"x": 311,
"y": 76,
"width": 4,
"height": 18,
"top": 76,
"right": 315,
"bottom": 94,
"left": 311
},
"currentRect": {
"x": 311,
"y": 246,
"width": 4,
"height": 18,
"top": 246,
"right": 315,
"bottom": 264,
"left": 311
}
}
]
```
The `node` property identifies the HTML element that shifted. Hovering on this
property in DevTools highlights the corresponding page element.
The `previousRect` and `currentRect` properties report the size and position of
the node.
- The `x` and `y` coordinates report the x-coordinate and y-coordinate respectively of the top-left corner of the element
- The `width` and `height` properties report the width and height respectively of the element.
- The `top`, `right`, `bottom`, and `left` properties report the x or y coordinate values corresponding to the given edge of the element. In other words, the value of `top` is equal to `y`; the value of `bottom` is equal to `y+height`.
If all properties of `previousRect` are set to 0 this means that the element has
shifted into view. If all properties of `currentRect` are set to 0 this means
that the element has shifted out of view.
> [!CAUTION]
> **Caution:** Layout Instability API does not ignore elements that shifted but were not visible due to another element being positioned in front of them. Use `display: none`, `visibility: hidden`, or `opacity: 0` to avoid layout shifts in cases where you need to run layout on some elements before you make them visible to the user.
One of the most important things to understand when interpreting these outputs
is that elements listed as *sources* are the elements that shifted during the
layout shift. However, it's possible that these elements are only indirectly
related to the "root cause" of layout instability. Here are a few examples.
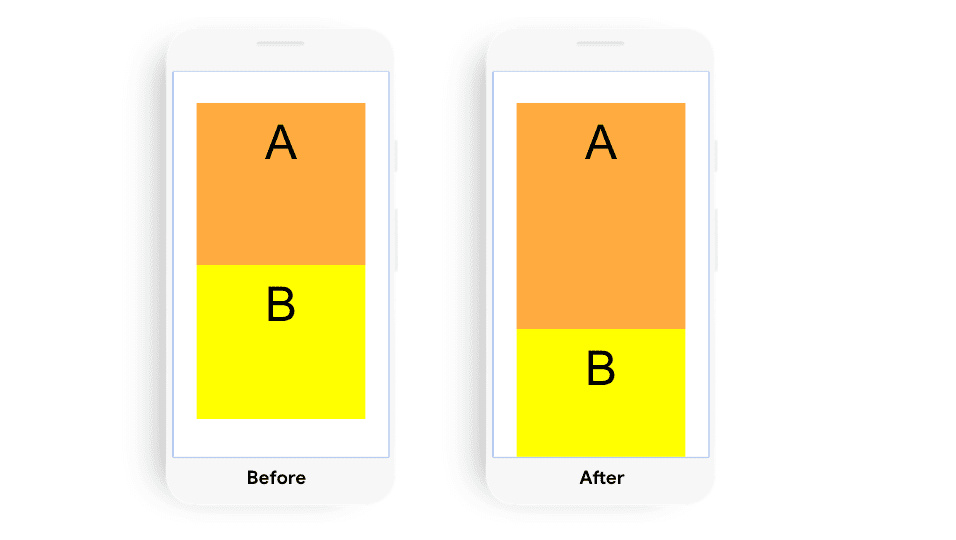
**Example #1**
This layout shift would be reported with one source: element B. However, the
root cause of this layout shift is the change in size of element A.
**Example #2**
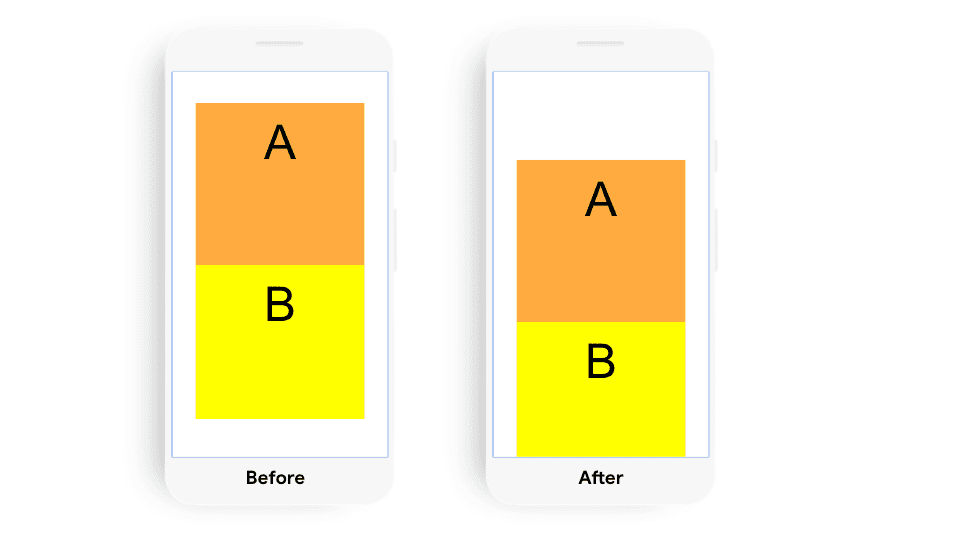
The layout shift in this example would be reported with two sources: element A
and element B. The root cause of this layout shift is the change in position of
element A.
**Example #3**
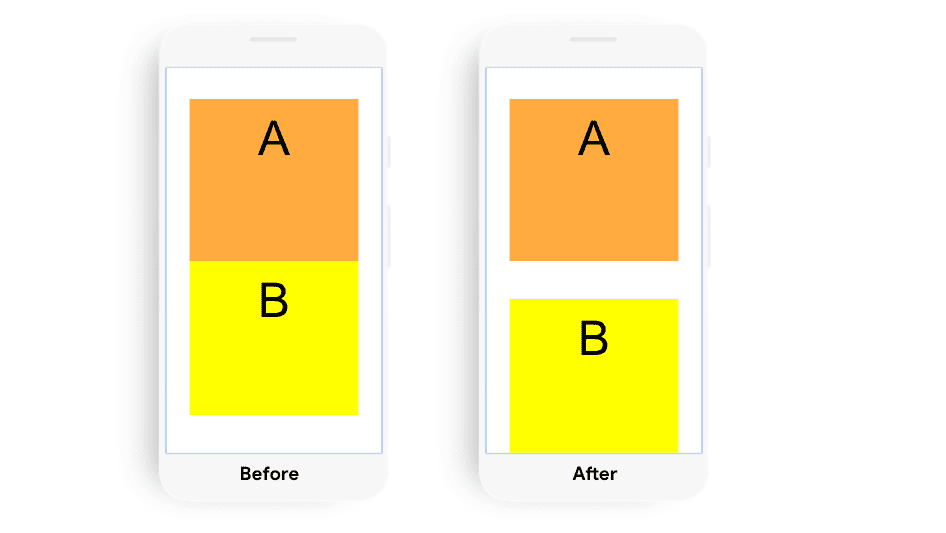
The layout shift in this example would be reported with one source: element B.
Changing the position of element B resulted in this layout shift.
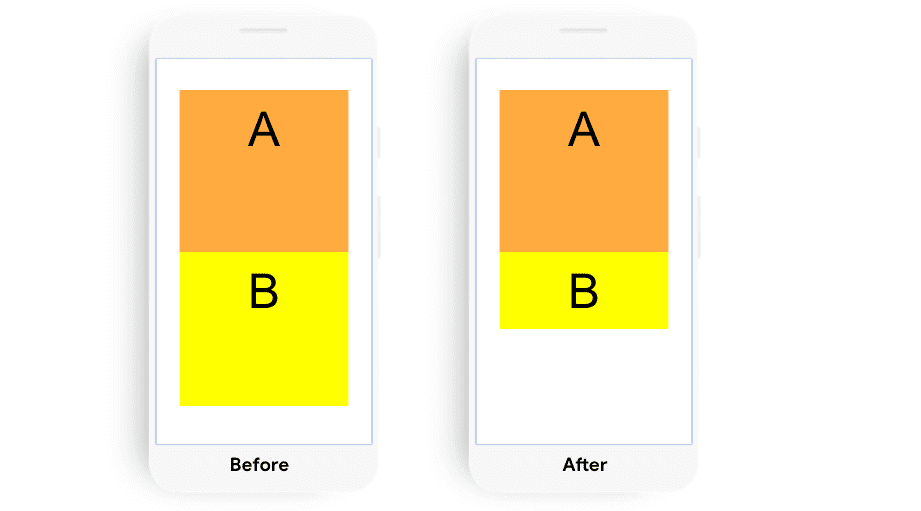
**Example #4**
Although element B changes size, there is no layout shift in this example.
Check out a [demo of how DOM changes are reported by the Layout Instability API](https://desert-righteous-router.glitch.me/).
### DevTools
DevTools has a number of tools to help debug layout shifts.
#### Performance panel
The live metrics view of the [Performance panel](https://developer.chrome.com/docs/devtools/evaluate-performance) lets you interact with the page and monitor the CLS score to identify interactions causing large layout shfts.
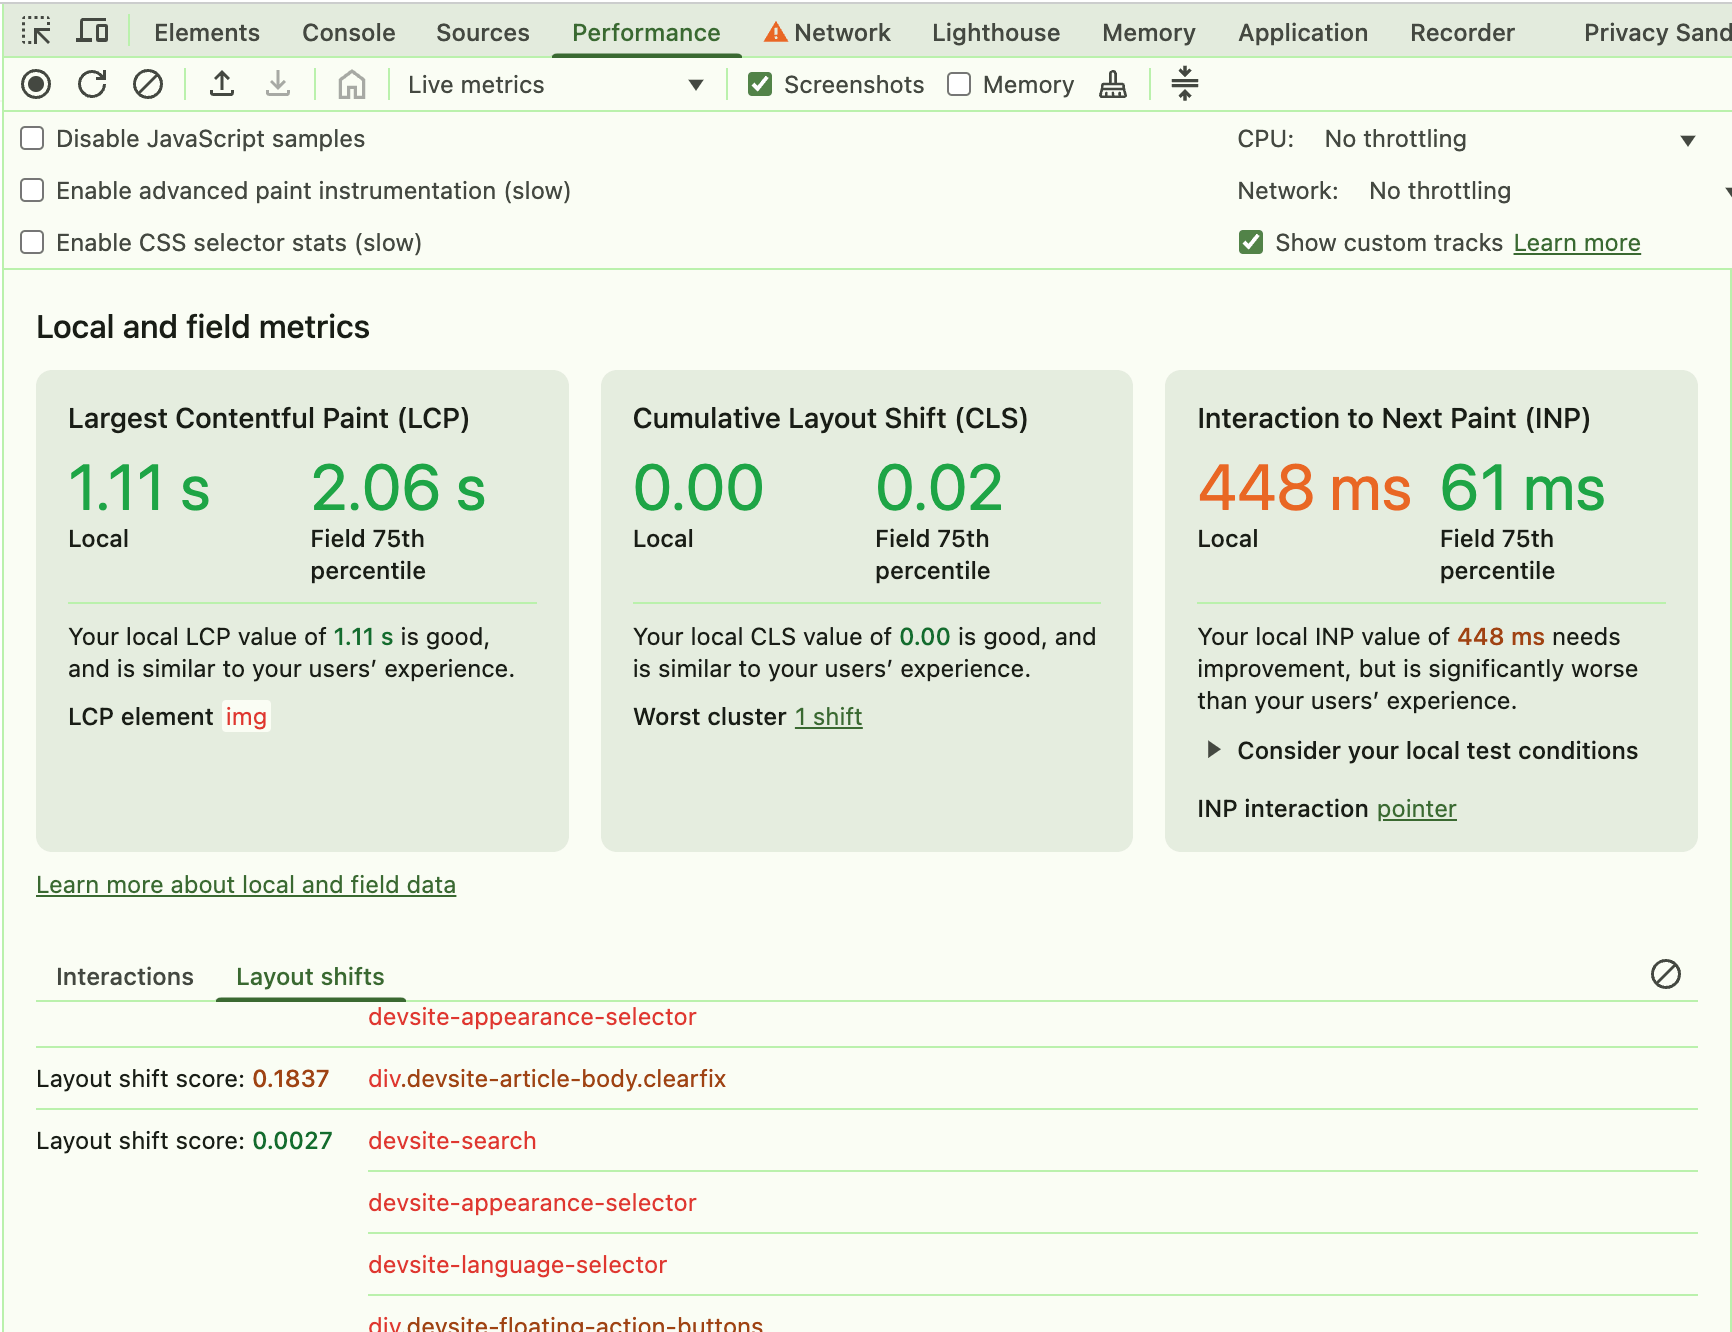 The live metrics view of the Performance Panel allows monitoring of a web page's CLS score while interacting with the page.
Once you can reliable reproduce a layout shift, you can perform a trace to get even more details:
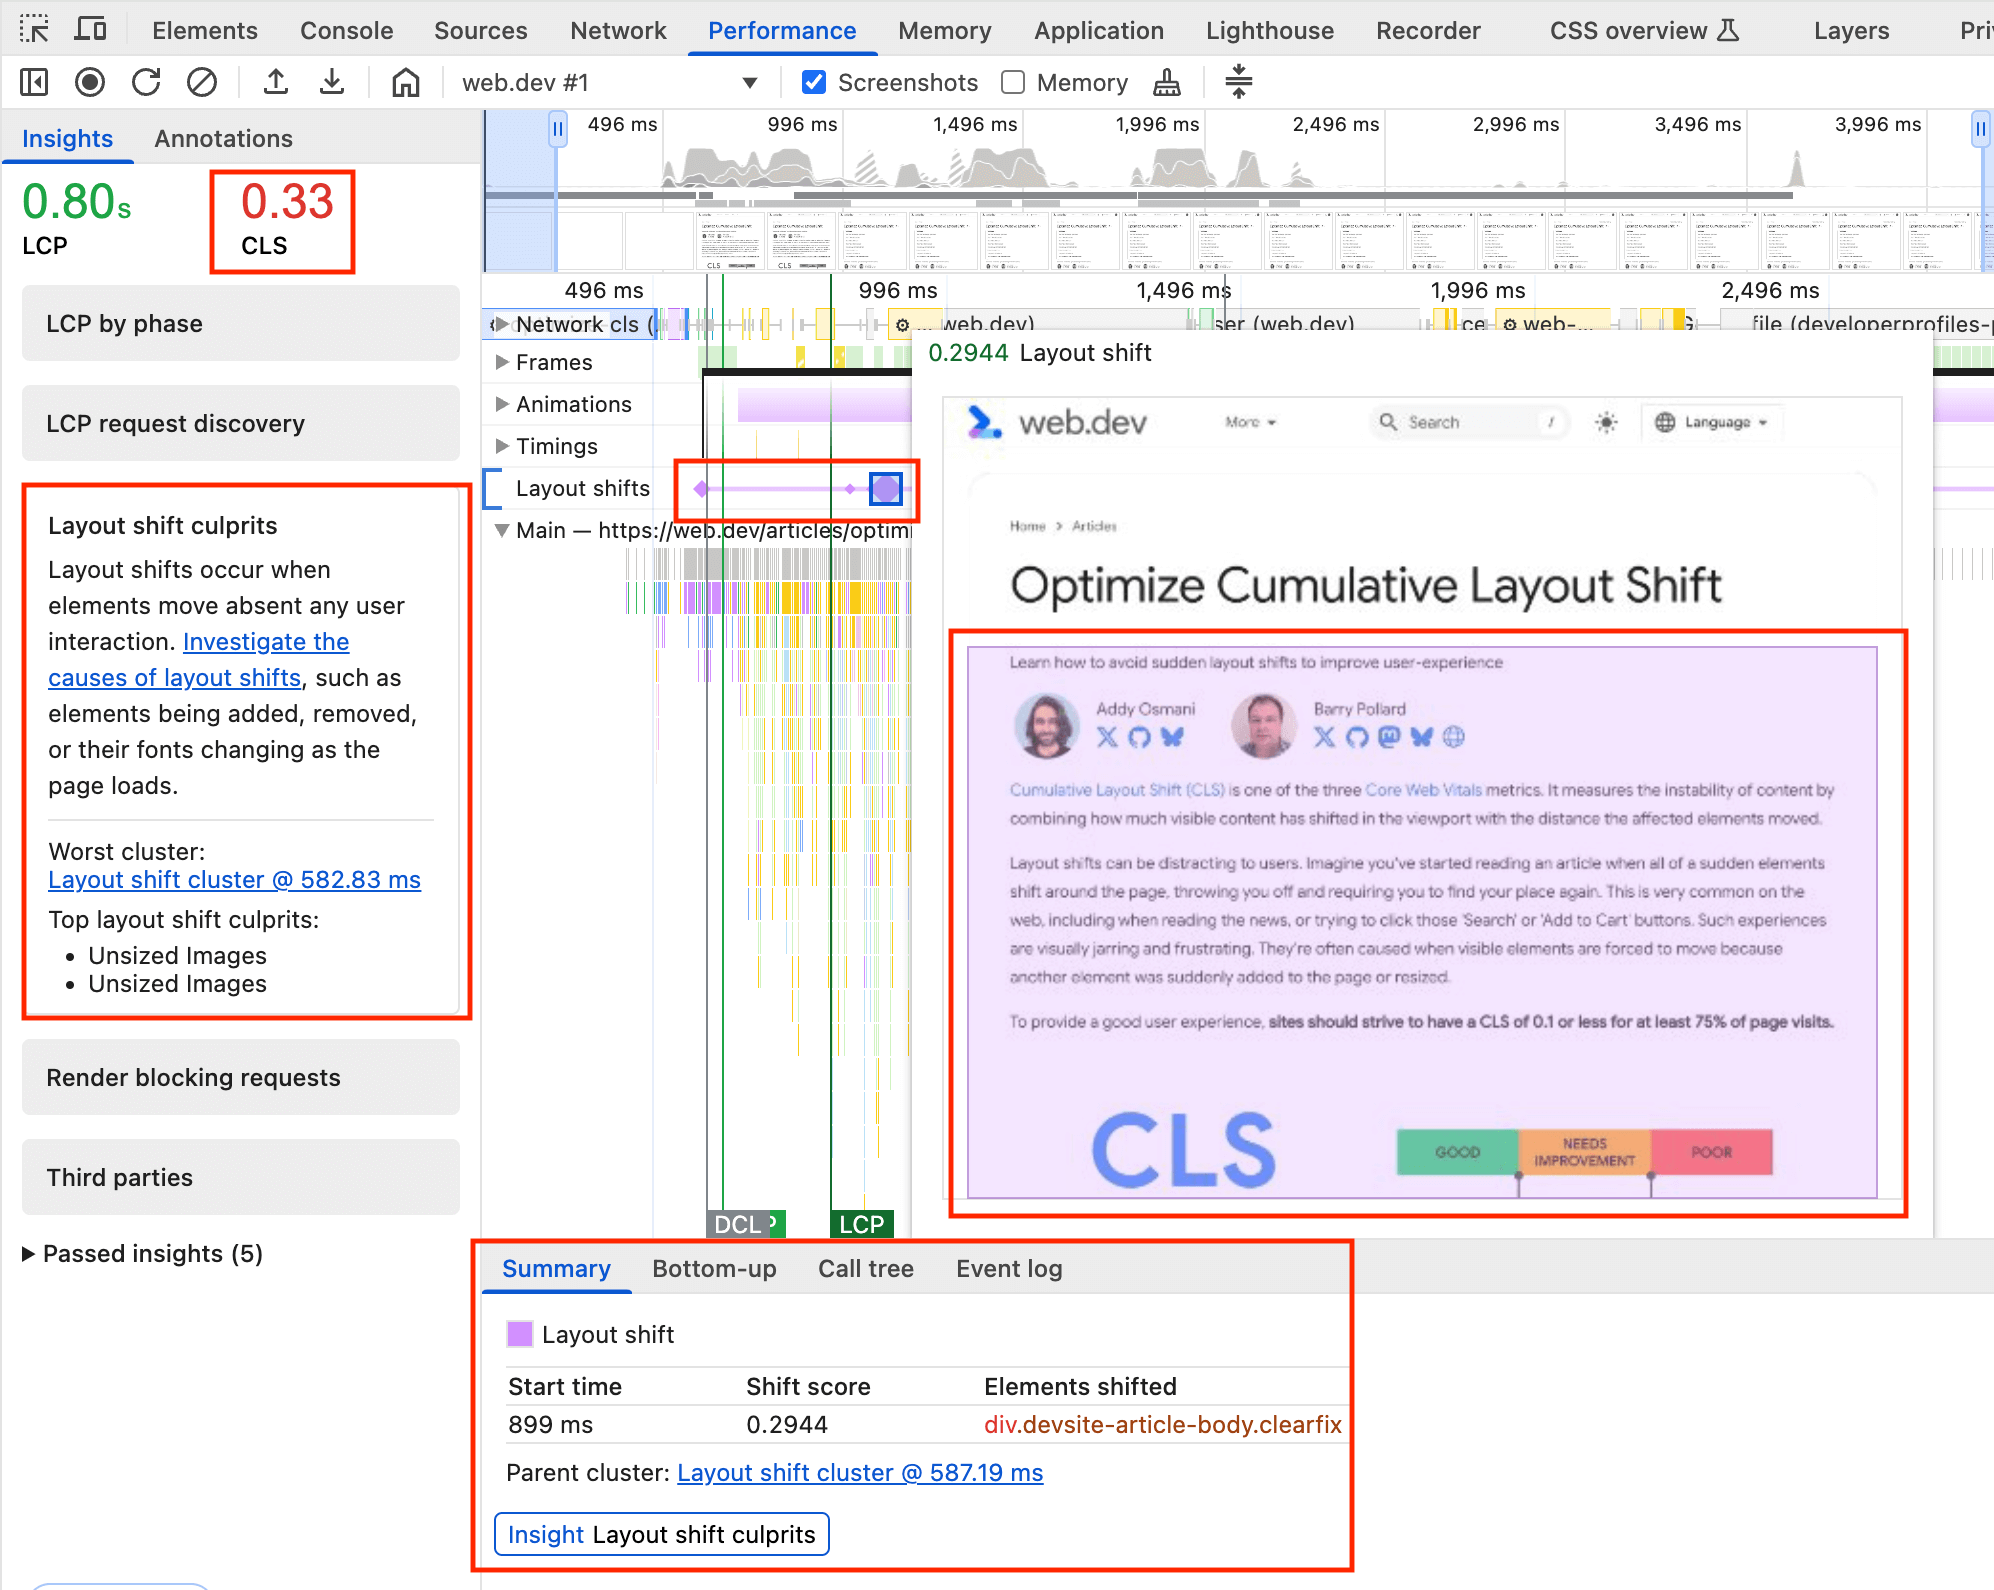 After recording a new trace in the Performance panel, the **Layout Shifts** track of the results is populated with purple bars displaying a `Layout Shift` clusters. Clicking the diamonds shows an animation of the shift and details in the **Summary** panel.
Layout shifts are highlighted in the **Layout shifts** track. The purple line groups shifts into shift clusters with the diamonds showing individual shifts in that cluster. The size of the diamond is proportional to the size of the shift allowing you to hone in on the largest shifts.
Clicking on a shift shows a pop up with an animation of the shift and highlights the elements shift in purple.
Additionally, the **Summary** view for a `Layout Shift` record includes the start time, the shift score as well as the elements shifted. This is particularly helpful to get more detail on load CLS issues since this is easily replicated with a reload performance profile.
This also links to the **Layout shift culprits** insight displayed in the **Insights** panel on the left, which shows the total CLS at the top, as well as possible reasons for layout shifts.
For more information on using the **Performance** panel, refer to [Performance
Analysis
Reference](https://developer.chrome.com/docs/devtools/evaluate-performance/reference).
#### Highlight layout shift regions
Highlighting layout shift regions can be a helpful technique for getting a
quick, at-a-glance feel for the location and timing of the layout shifts
occurring on a page.
To enable Layout Shift Regions in DevTools, go to **Settings \> More Tools \>
Rendering \> Layout Shift Regions** then refresh the page that you want to debug.
Areas of layout shift will be briefly highlighted in purple.
## Thought process for identifying the cause of layout shifts
You can use the following steps to identify the cause of layout shifts
regardless of when or how the layout shift occurs. These steps can be
supplemented with running Lighthouse---however, keep in mind that Lighthouse can
only identify layout shifts that occurred during the initial page load. In
addition, Lighthouse also can only provide suggestions for some causes of layout
shifts---for example, image elements that don't have explicit width and height.
### Identify the cause of a layout shift
Layout shifts can be caused by the following events:
- Changes to the position of a DOM element
- Changes to the dimensions of a DOM element
- Insertion or removal of a DOM element
- Animations that trigger layout
In particular, the DOM element immediately preceding the shifted element is the
element most likely to be involved in "causing" layout shift. Thus, when
investigating why a layout shift occurred consider:
- Did the position or dimensions of the preceding element change?
- Was a DOM element inserted or removed before the shifted element?
- Was the position of the shifted element explicitly changed?
If the preceding element did not cause the layout shift, continue your search by
considering other preceding and nearby elements.
In addition, the direction and distance of a layout shift can provide hints
about root cause. For example, a large downward shift often indicates the
insertion of a DOM element, whereas a 1 px or 2 px layout shift often indicates
the application of conflicting CSS styles or the loading and application of a
web font.
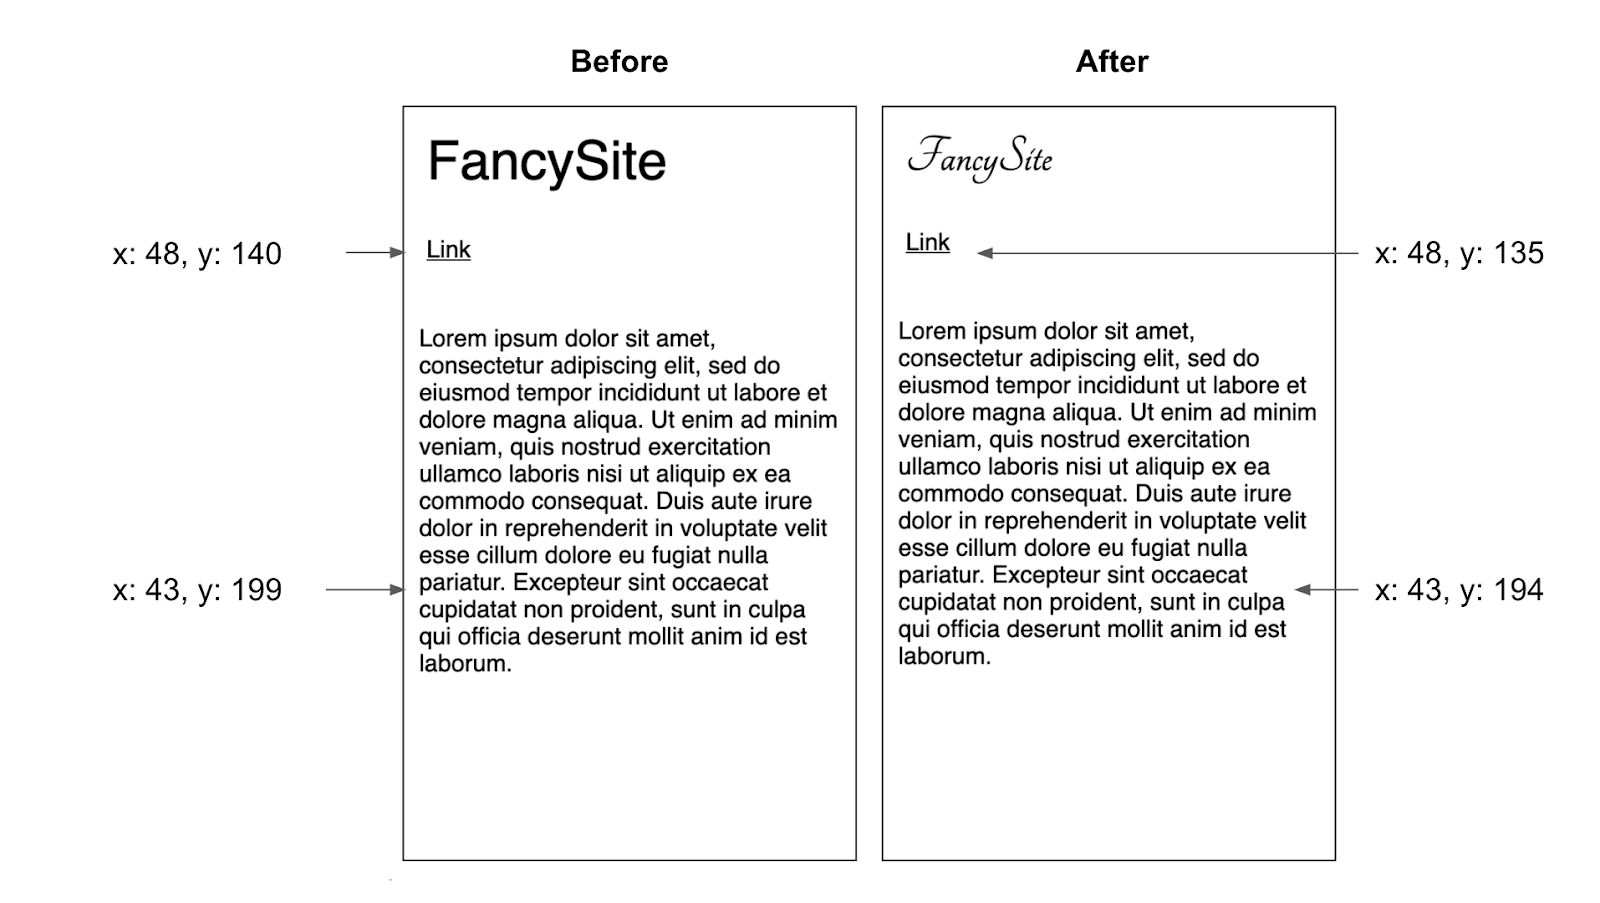 In this example, font swapping caused page elements to shift upwards by five pixels.
These are some of the specific behaviors that most frequently cause layout shift
events:
#### Changes to the position of an element (that aren't due to the movement of another element)
This type of change is often a result of:
- Stylesheets that are loaded late or overwrite previously declared styles.
- Animation and transition effects.
#### Changes to the dimensions of an element
This type of change is often a result of:
- Stylesheets that are loaded late or overwrite previously declared styles.
- Images and iframes without `width` and `height` attributes that load after their "slot" has been rendered.
- Text blocks without `width` or `height` attributes that swap fonts after the text has been rendered.
#### The insertion or removal of DOM elements
This is often the result of:
- Insertion of ads and other third-party embeds.
- Insertion of banners, alerts, and modals.
- Infinite scroll and other UX patterns that load additional content above existing content.
#### Animations that trigger layout
Some animation effects can [trigger
layout](https://gist.github.com/paulirish/5d52fb081b3570c81e3a). A common
example of this is when DOM elements are 'animated' by incrementing properties
like `top` or `left` rather than using CSS's
[`transform`](https://developer.mozilla.org/docs/Web/CSS/transform)
property. Read [How to create high-performance CSS animations](https://web.dev/articles/animations-guide.md.txt)
for more information.
### Reproduce layout shifts
You can't fix layout shifts that you can't reproduce. One of the simplest, yet
most effective things you can do to get a better sense of your site's layout
stability is take 5-10 minutes to interact with your site with the goal
triggering layout shifts. Keep the console open while doing this and use the
Layout Instability API to report on layout shifts.
For hard to locate layout shifts, consider repeating this exercise with
different devices and connection speeds. In particular, using a slower
connection speed can make it easier to identify layout shifts. In addition,
you can use a `debugger` statement to make it easier to step through layout
shifts.
new PerformanceObserver((entryList) => {
for (const entry of entryList.getEntries()) {
if (!entry.hadRecentInput) {
cls += entry.value;
debugger;
console.log('Current CLS value:', cls, entry);
}
}
}).observe({type: 'layout-shift', buffered: true});